Company Introduction
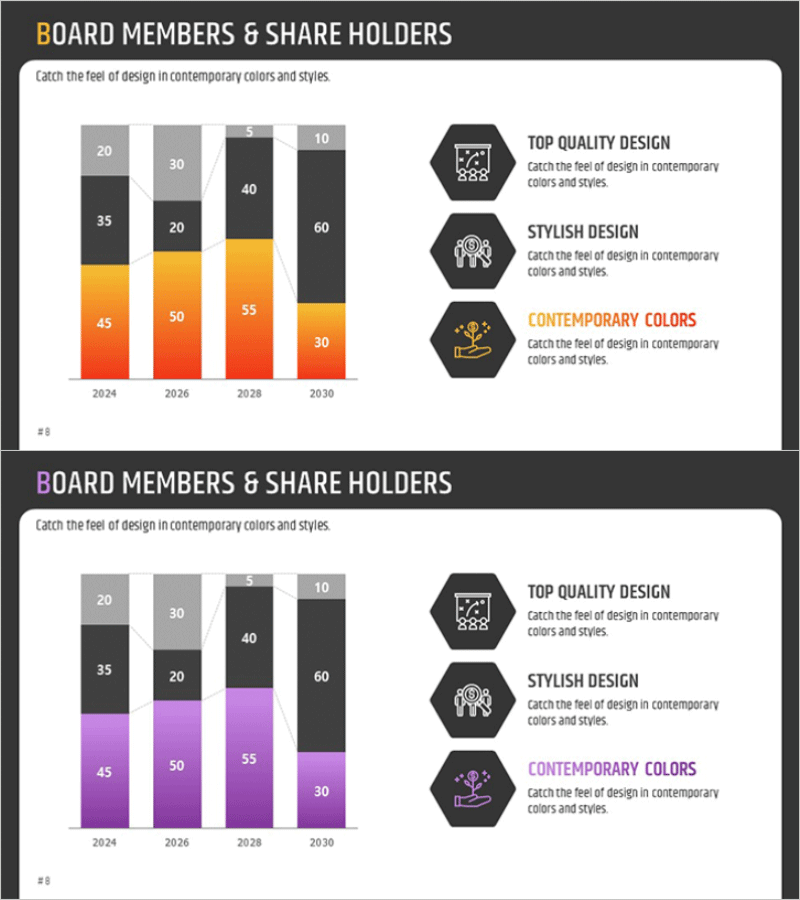
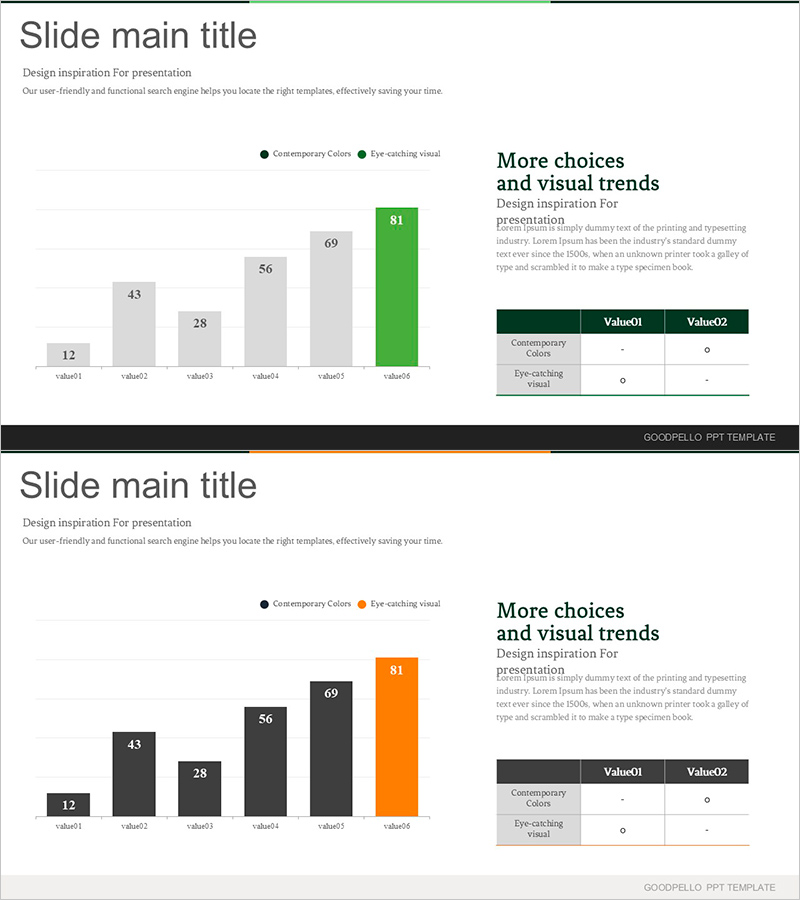
Performance Analysis Breakdown Bar Graph – Market and Competitor Analysis
RM0300009_7
- Last Update 12/21/2025
- File Size 0.3MB
- # of Slides 2
- File Format PPTX
- Slide Ratio 16:9
- Color
Keywords
- #Content-Based Slides
- #Design-Based Slides
- #Company Introduction
- #Market and Competitor Analysis
- #Diagram
- #Graph
- #Shareholder Structure
- #Market Analysis
- #Cluster
- #Horizontal Bar
- #Closed Cluster Diagram
- #Segmented Horizontal Bar
- #16:9
- #Performance Analysis
- #Breakdown Bar Graph
- #Market Analysis
- #Shareholder Status
- #Competitor Analysis
About the Product
This slide utilizes a breakdown bar graph to visualize performance analysis intuitively. The harmonious combination of orange and purple colors effectively conveys data status and analytical results. This graph is suitable for reviewing shareholder statuses or analyzing market competition, helping to simplify complex data for better understanding. The slide allows for easy replacement of text and data fields, with an overall editing difficulty rated as 'easy'.
Related Products
-
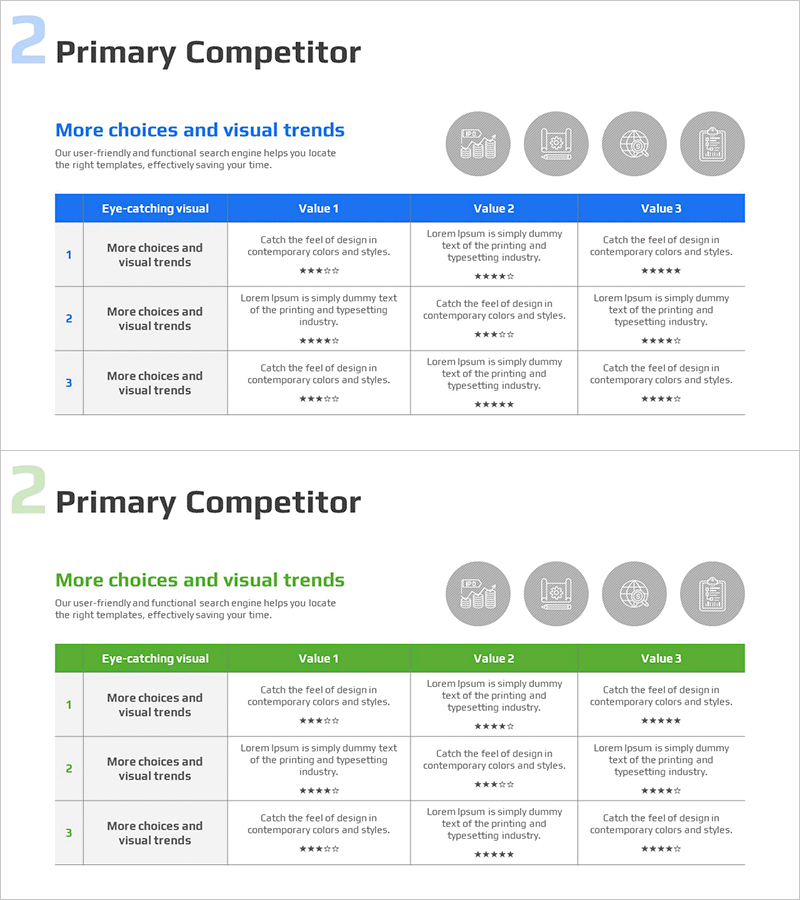
Competitor Marketing Strategy and Performance Analysis Chart
#Market and Competitor Analysis #Diagram #Competitor Analysis
-
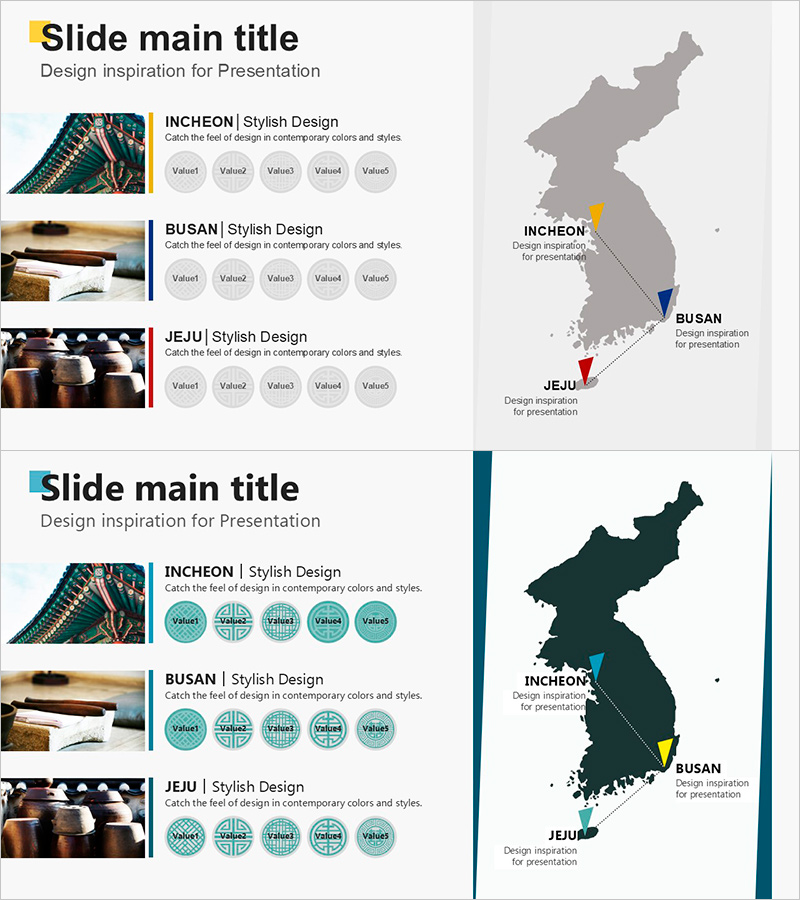
Korean Tourist Destination Route – Business Management Diagram
#Business Management #Diagram #Other
-
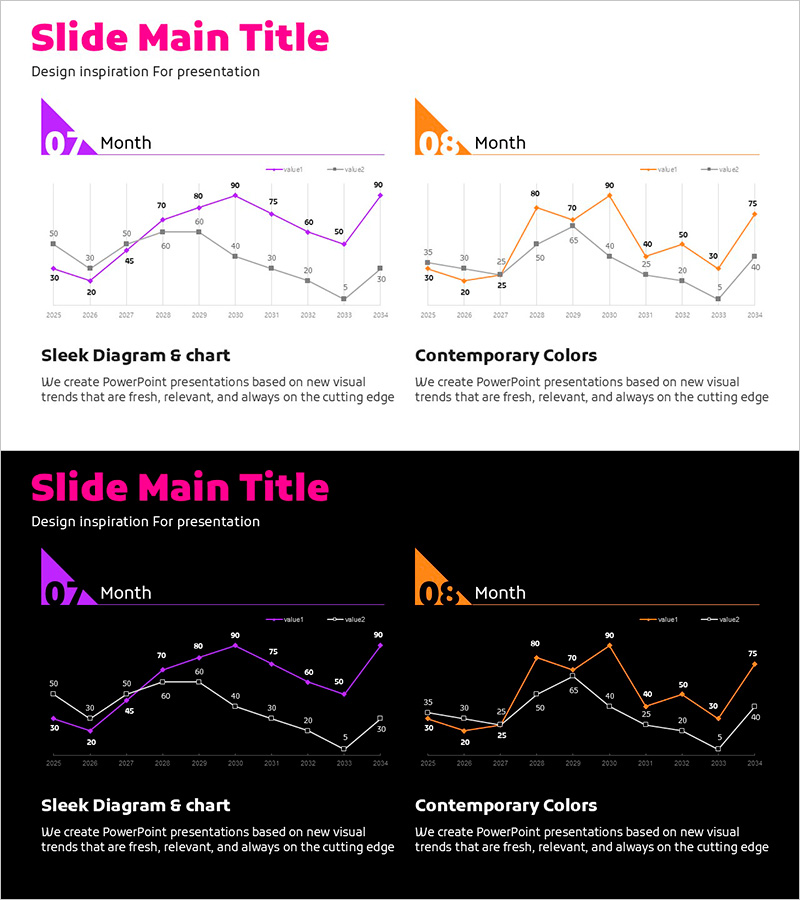
Purple Orange Curved Line Chart – Visualizing Competitive Edge
#Market and Competitor Analysis #Graph #Competitor Analysis
-
Analysis and Graphs in Future Prediction – Market Strategy and Profitability
#Business Promotion Strategy #Market and Competitor Analysis #Diagram
