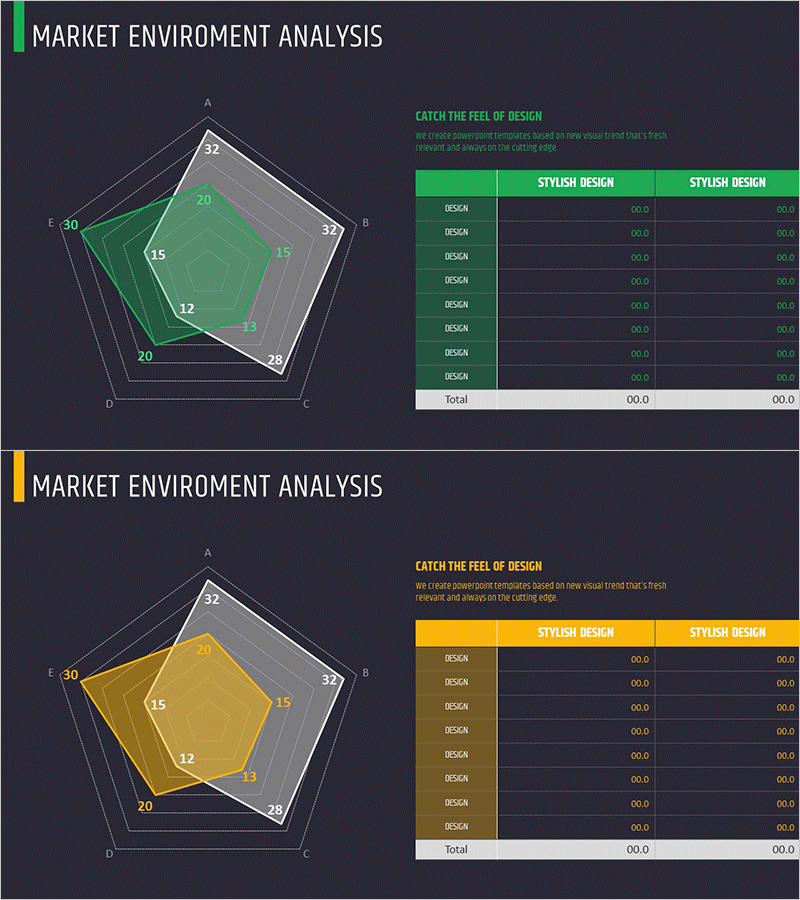
Market and Competitor Analysis
Business Status Analysis Graph & Table – Visualization of Market Analysis
RM0200011_13
- Last Update 12/21/2025
- File Size 1MB
- # of Slides 2
- File Format PPTX
- Slide Ratio 16:9
- Color
Keywords
About the Product
This slide utilizes graphs and tables for a detailed business status analysis, visually emphasizing market conditions. The combination of graphical diagrams and tables clearly conveys data, while the green and yellow color scheme provides both trust and energy. It is particularly suitable for market and competitive analysis presentations, ideal for data-driven reports and proposals. The text and data sections are easily replaceable, making the editing difficulty rated as 'moderate'.
Related Products
-

Orange Purple Man Power Slide – Cluster Design
#Company Introduction #Diagram #Manpower
-
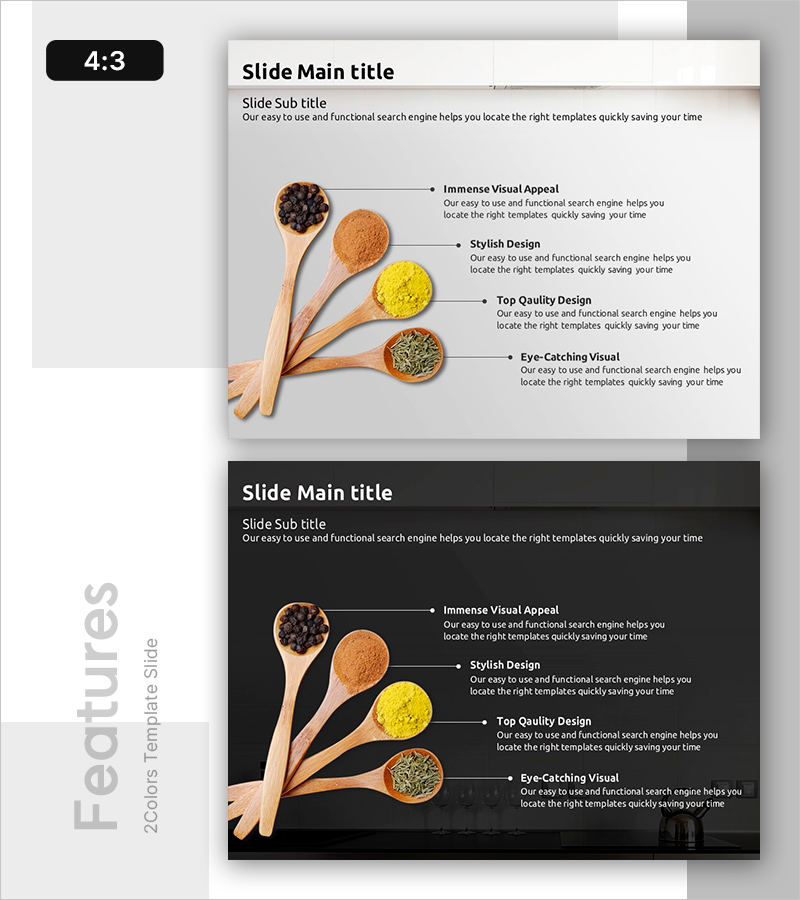
Visual Diagram for Introducing Seasonings
#Product/Service #Diagram #Product/Service Introduction
-
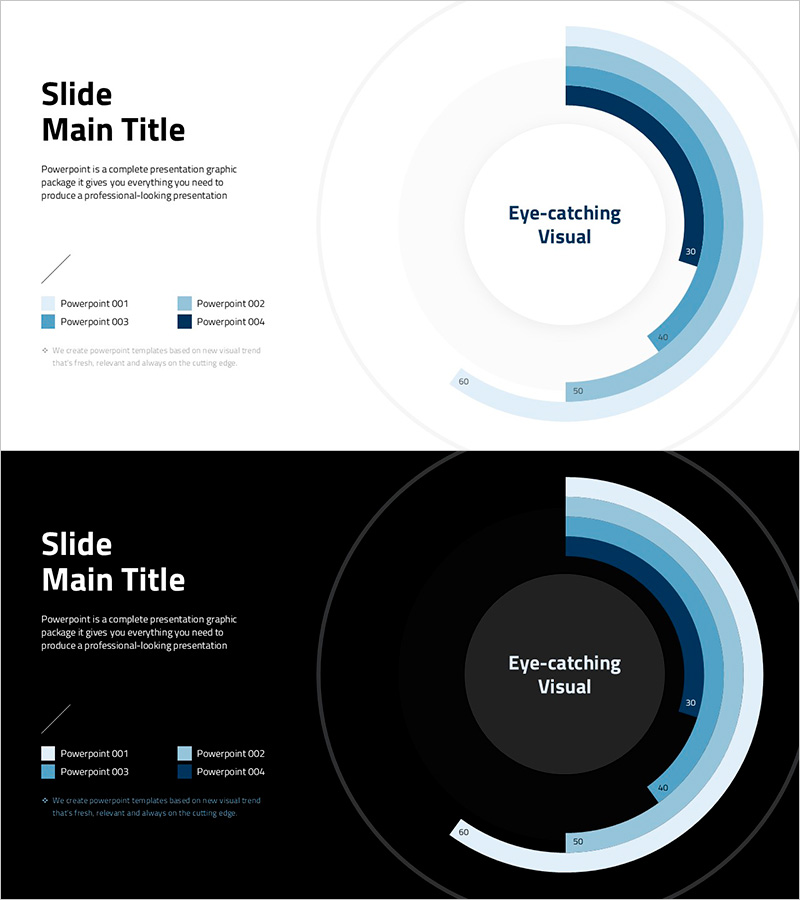
Visualizing Simple Design Trend with Donut Chart PPT
#Company Introduction #Product/Service #Graph
-

Oriental Medicine Treatment Program Introduction – Visual Appeal and Quality Design
#Product/Service #Diagram #Program Introduction
