Company Introduction
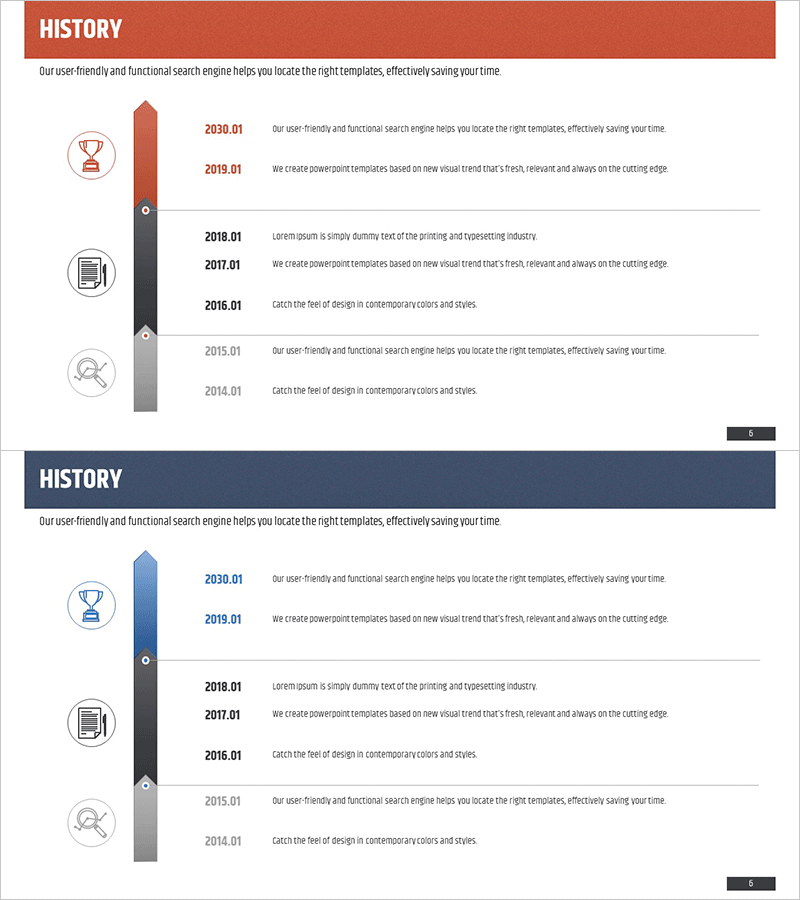
History Vertical Arrow Diagram – Business Flow Visualization
RM0200003_5
- Last Update 12/21/2025
- File Size 2.8MB
- # of Slides 2
- File Format PPTX
- Slide Ratio 16:9
- Color
Keywords
About the Product
This slide is a vertical arrow diagram designed to effectively present historical information. With a clean and concise design, it intuitively shows important milestones and development processes, making it ideal for showcasing a company’s key achievements. The red and blue color palette conveys trust, while the clustered design elements create a natural flow between points. This slide is optimized for use in corporate presentations, reports, and historical overviews, allowing for immediate application in various business contexts. Editing difficulty is rated as 'easy', making text changes straightforward for quick integration into any PowerPoint presentation.
Related Products
-
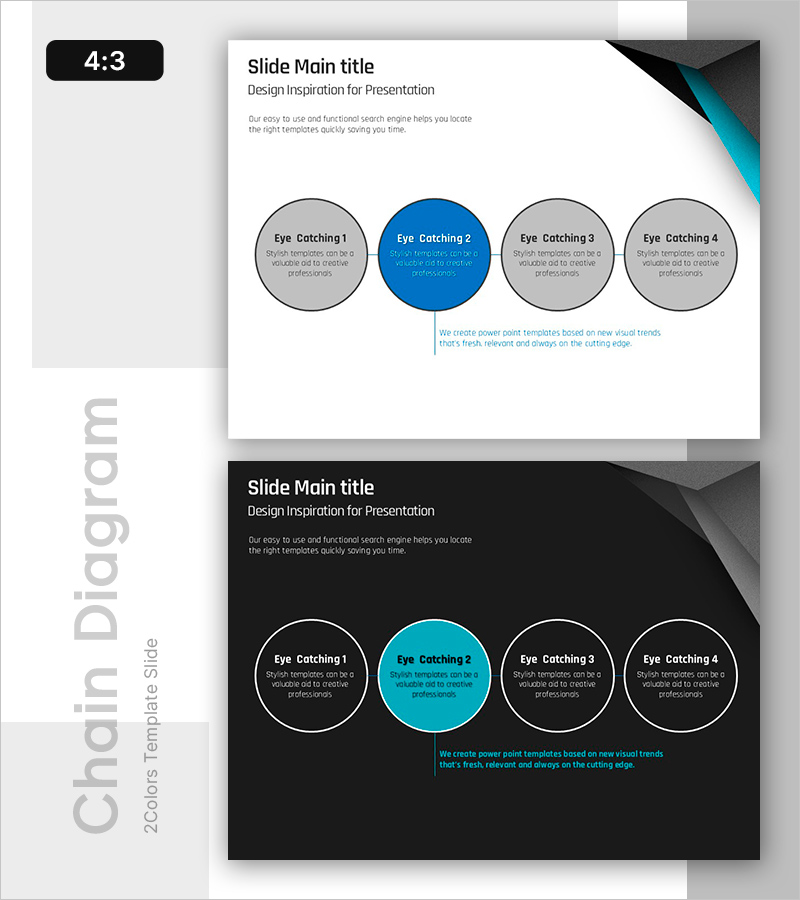
Blue Chain Diagram – Strategic Mindset for Business Initiatives
#Business Promotion Strategy #Business Management #Diagram
-
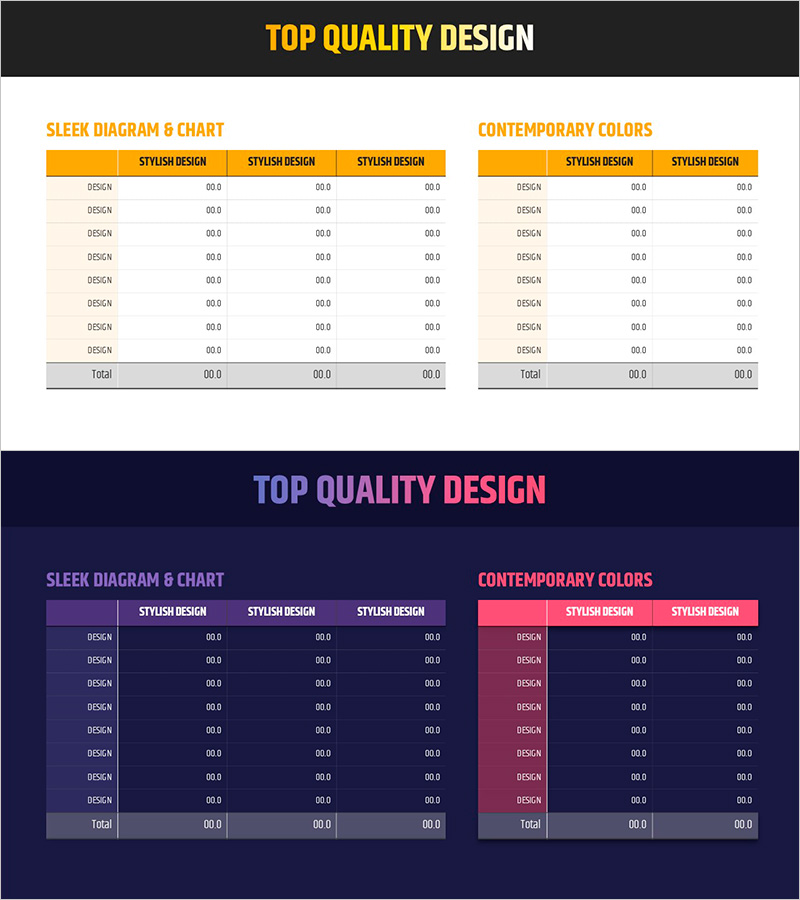
Simple Yellow Purple Table – Financial Performance Visualization
#Financial Plans and Performance #Diagram #Balance Sheet
-

3D Printer Usage Area Diagram – Effective Visualization for Business Introduction
#Company Introduction #Business Introduction #Diagram
-
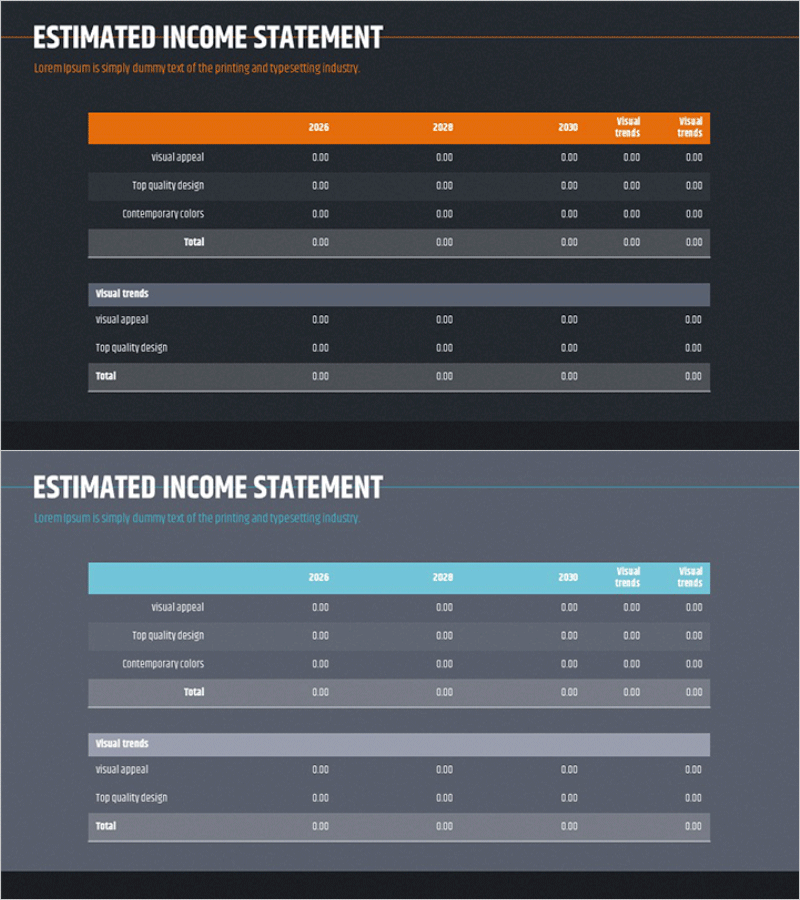
Annual Sales and Profit Analysis Table – Key to Financial Planning
#Financial Plans and Performance #Diagram #Cash Flow Statement
