3D Printer Usage Area Diagram – Effective Visualization for Business Introduction
RJ0400036_25
- Last Update 05/27/2025
- File Size 0.5MB
- # of Slides 2
- File Format PPTX
- Slide Ratio 16:9
- Color
Keywords
- #Content-Based Slides
- #Design-Based Slides
- #Company Introduction
- #Business Introduction
- #Diagram
- #Business Areas
- #Business Areas
- #Spread
- #Centralized Diagram
- #16:9
- #radial diagram PowerPoint
- #center hub diagram slide
- #8-node diagram template
- #business area visualization
- #technology application diagram PowerPoint
About the Product
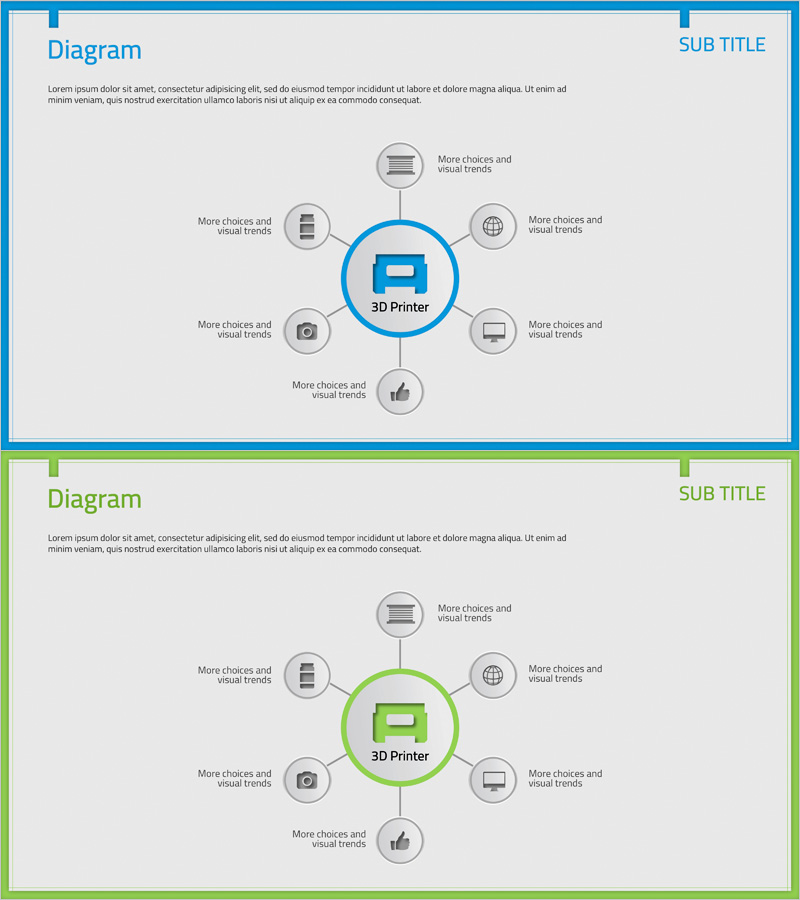
A PowerPoint slide featuring a radial diagram that visualizes the application areas of 3D printing technology. The central hub is surrounded by eight nodes representing related fields, using blue and green dual-tone colors to convey innovation and technological advancement. This presentation resource effectively communicates information structure across various business contexts including company introductions, business scope explanations, and technology application demonstrations. The 2-slide set provides both blue and green versions, optimized for 16:9 widescreen format to suit modern presentation environments.
Usage Points
-
Main Usage
Clearly present organizational business areas, product application scope, and technology implementation domains using a center-hub structure. The 8-node configuration effectively conveys information hierarchy, enabling strategic communication of business range and scope in professional presentations.
-
How to Use
Apply in company introductions, new business area explanations, technology use case presentations, and product diversification strategy discussions. Enter the core topic in the central circle and detailed items in the eight surrounding nodes. Select the blue version to emphasize technology and trust, or the green version to highlight growth and innovation.
-
Recommended For
Ideal for IT and technology companies presenting business scope, manufacturers explaining product applications, startups showcasing business diversification, consulting firms presenting service portfolios, and educational institutions describing program structures.
-
Slide Structure
Two-slide set with identical diagram structure in blue and green color schemes. Each slide contains one central circular node connected to eight surrounding nodes via lines representing relationships. Designed in 16:9 widescreen format for optimal compatibility with contemporary presentation platforms.
Related Products
-

Sketch Icon Business Area Diagram – Visualizing Business Introduction
#Company Introduction #Business Introduction #Diagram
-

Travel Business Services Area – Effective Diagram Design
#Company Introduction #Business Introduction #Diagram
-

Mobile Security Service Diagram
#Company Introduction #Business Introduction #Diagram
-

Astronomy Earth Diagram PowerPoint – Visual Exploration
#Company Introduction #Business Introduction #Diagram
