Financial Plans and Performance
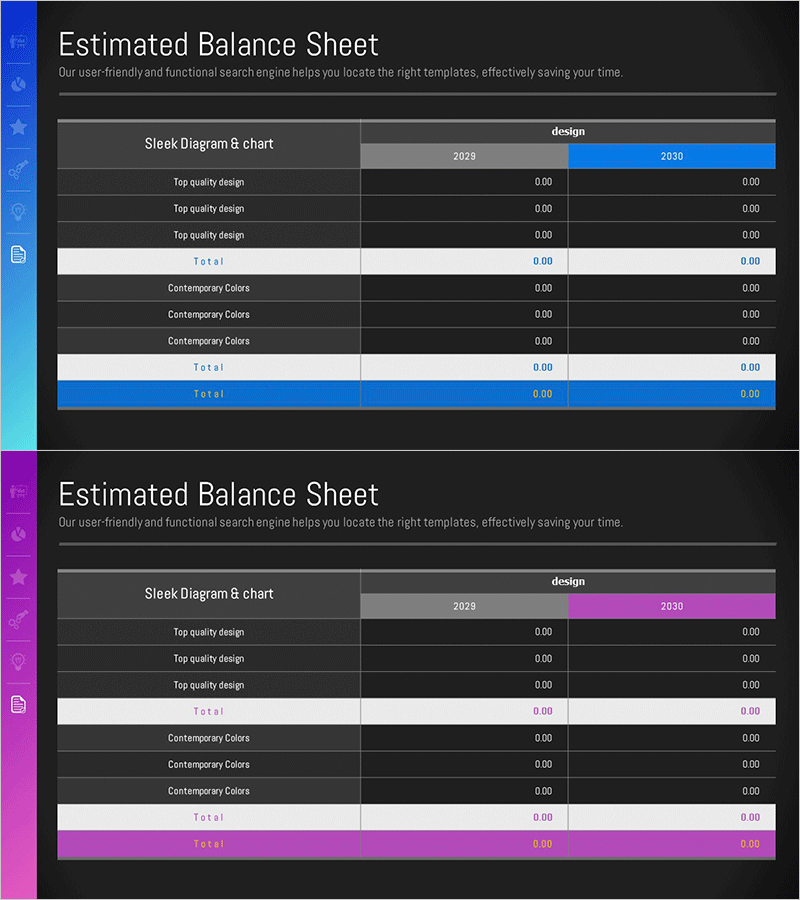
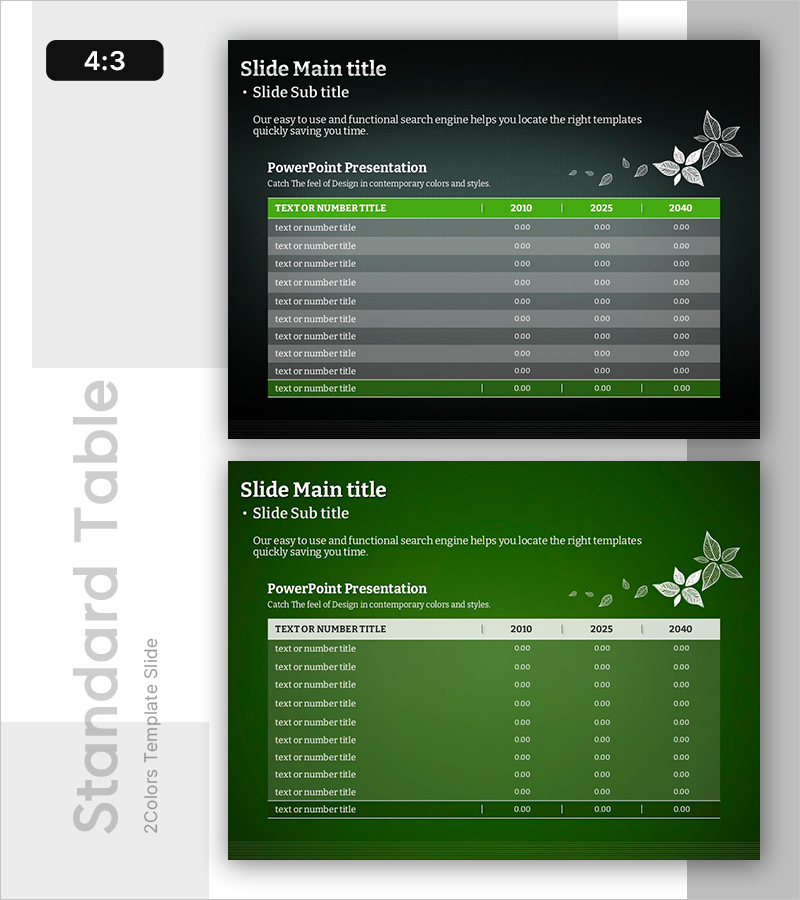
Last Year's Sales Comparison Analysis Table – Visually Representing Financial Performance
RM0100017_31
- Last Update 12/21/2025
- File Size 0.2MB
- # of Slides 2
- File Format PPTX
- Slide Ratio 16:9
- Color
Keywords
About the Product
This slide provides a table for last year's sales comparison analysis, aiding clear comparisons of financial performance across years. Its concise and intuitive design makes it highly effective for annual reports, planning documents, and financial analyses, particularly optimized for expressing ‘financial performance’. Featuring modern blue and purple colors, the slide ensures readability. Users can easily replace data within the table, and the overall editing difficulty is rated as ‘easy’ for quick modifications.
Related Products
-
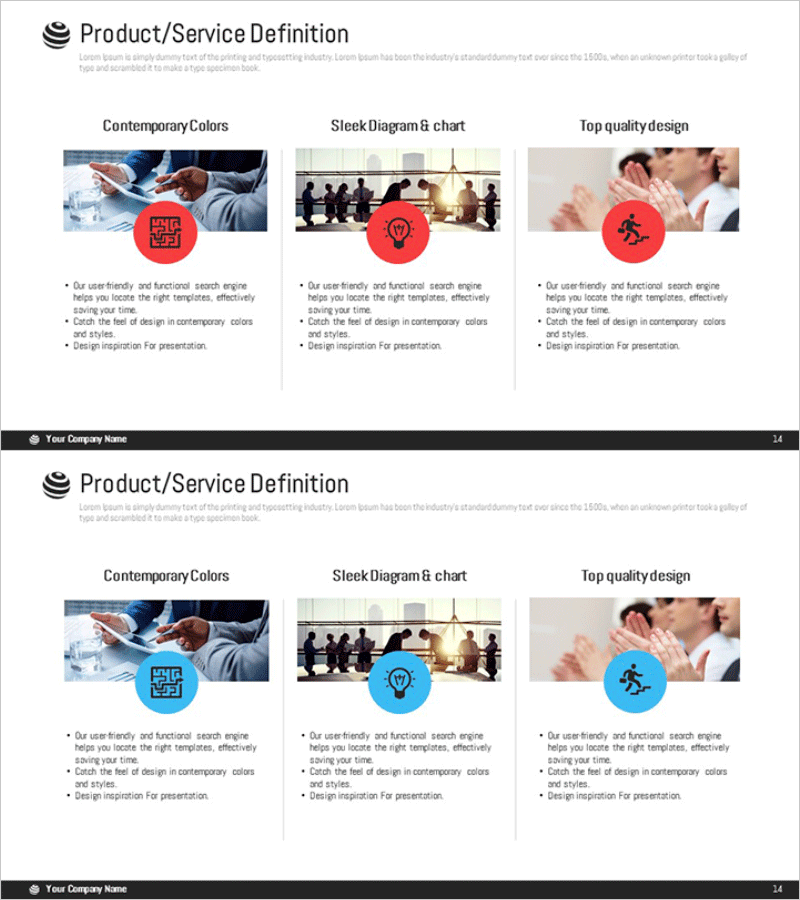
Program Introduction Closed Diagram – Clear Structure and Communication
#Product/Service #Diagram #Product/Service Introduction
-
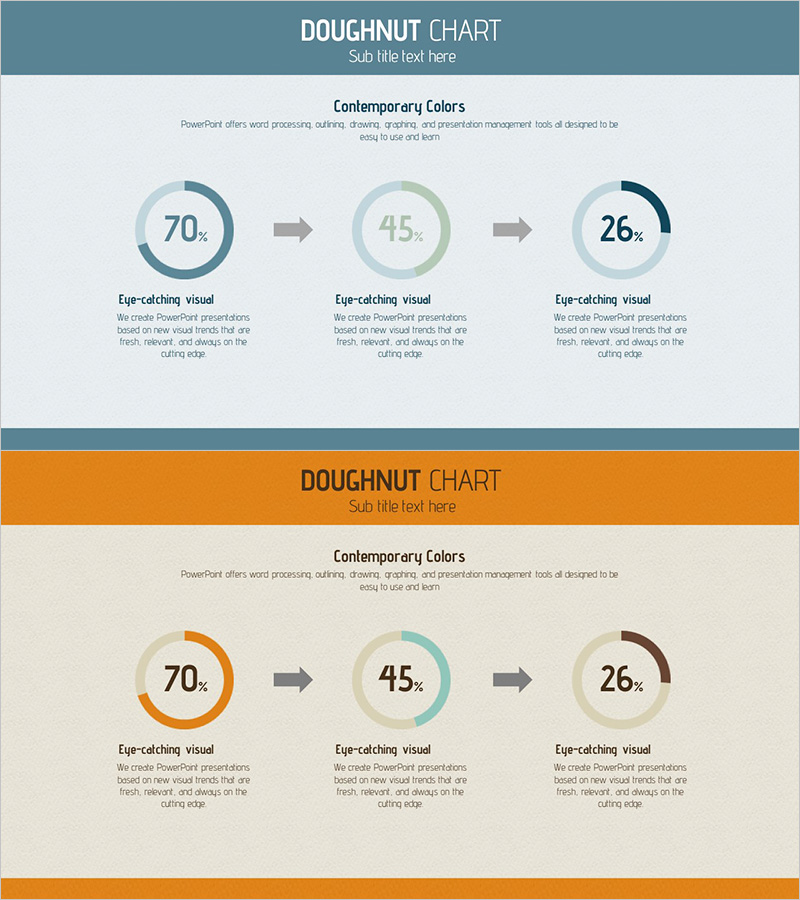
Progress Status Order Circle Graph – Visualizing Project Progress
#Product/Service #Business Introduction #Diagram
-
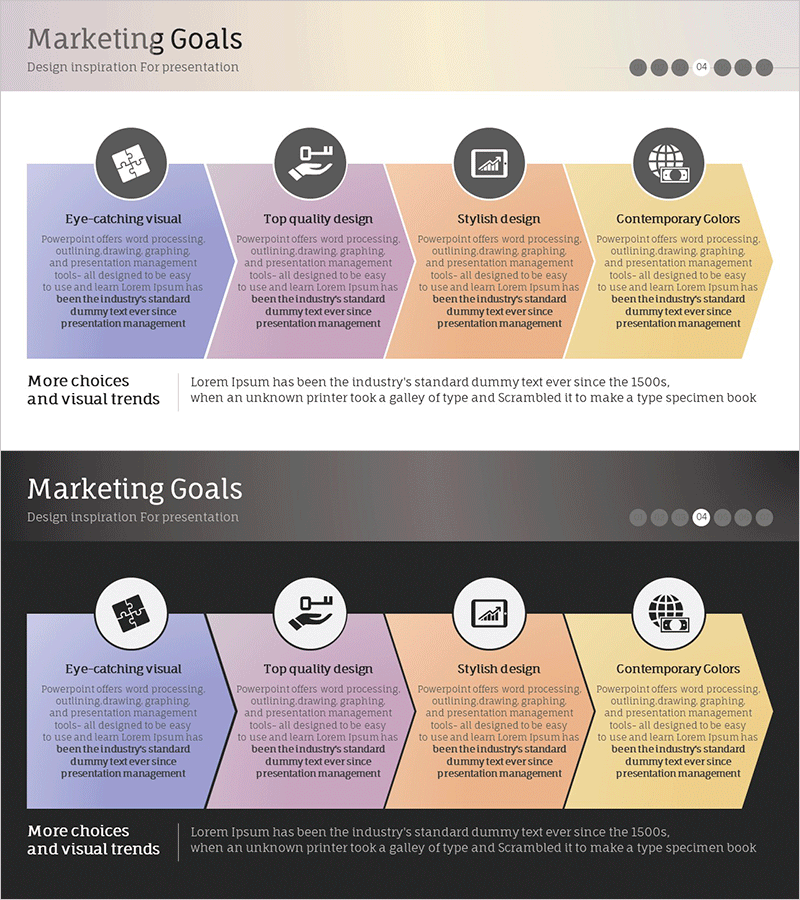
Marketing Achievement Goals for Brand Growth – Vision and Strategy
#Business Vision and Strategy #Marketing Plan and Strategy #Diagram
-
Tree PPT Year-by-Year Table – Market and Competitor Analysis
#Product/Service #Market and Competitor Analysis #Diagram
