Market and Competitor Analysis
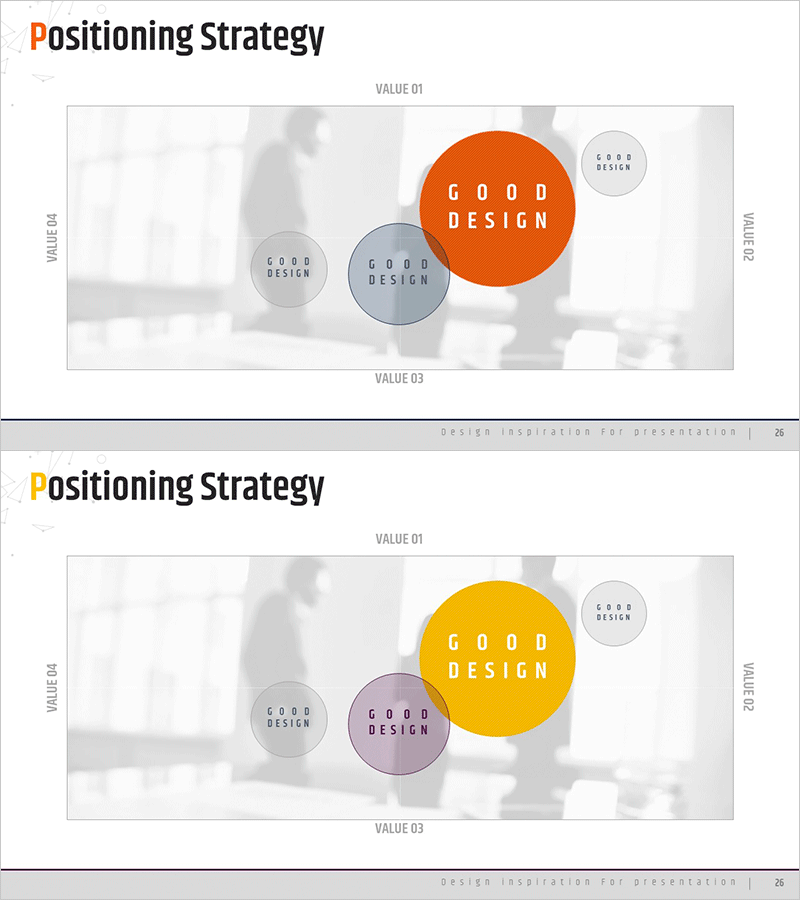
Positioning Image Map Graph – Effective Visualization for Market Analysis
RM0100009_25
- Last Update 12/21/2025
- File Size 1.1MB
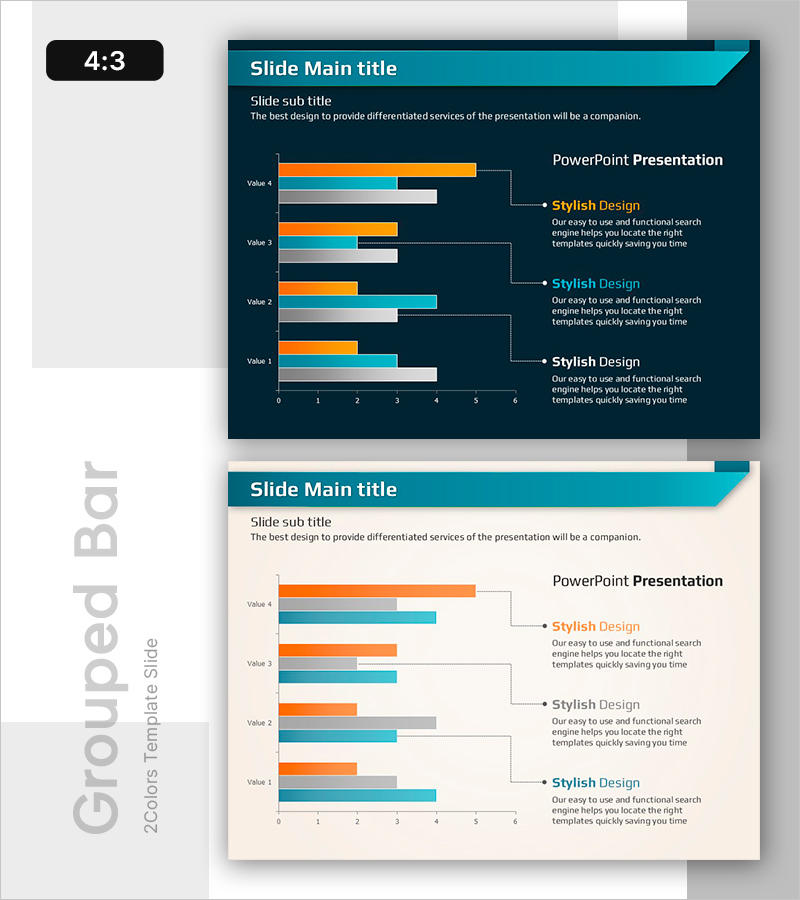
- # of Slides 2
- File Format PPTX
- Slide Ratio 16:9
- Color
Keywords
About the Product
This slide features a positioning image map graph optimized for visually analyzing markets and competitors. The graph clearly positions various design elements based on different value indicators, effectively conveying messages to users. The main colors, navy and purple, provide professionalism and trust, while the layout highlights each position distinctly. Ideal for market analysis reports or marketing strategy development with the emotional theme of 'competition'. Text and graph elements are easy to replace, and the editing difficulty is rated as 'moderate', allowing for seamless integration into various presentations.
Related Products
-
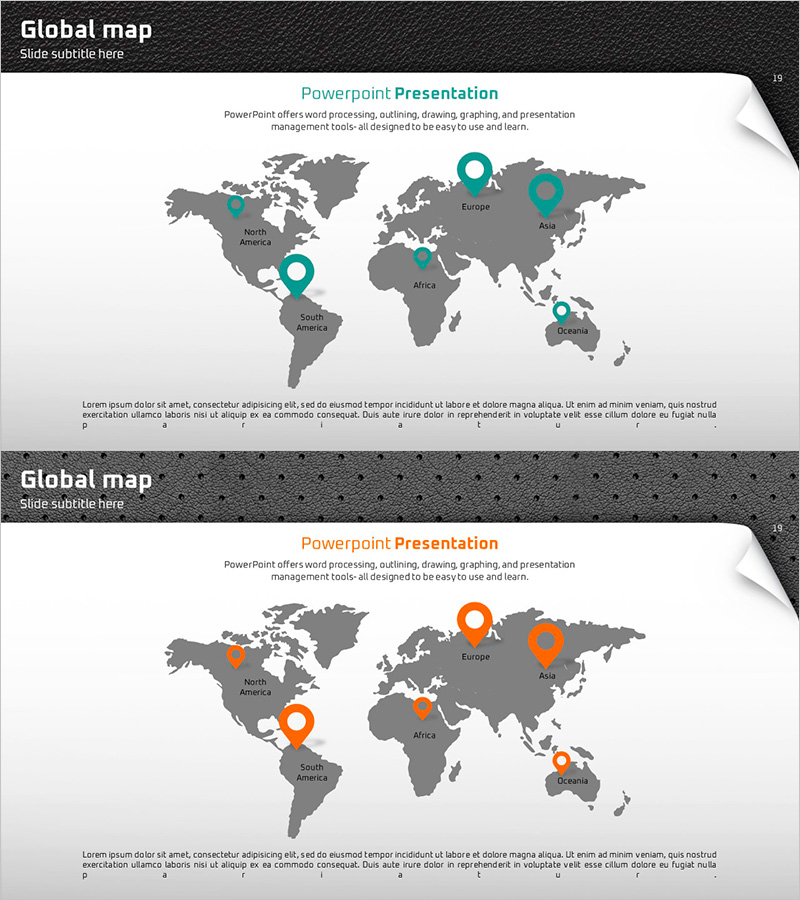
Map Template to Visualize Global Strategies – Quality Presentation
#Company Introduction #Marketing Plan and Strategy #Other
-
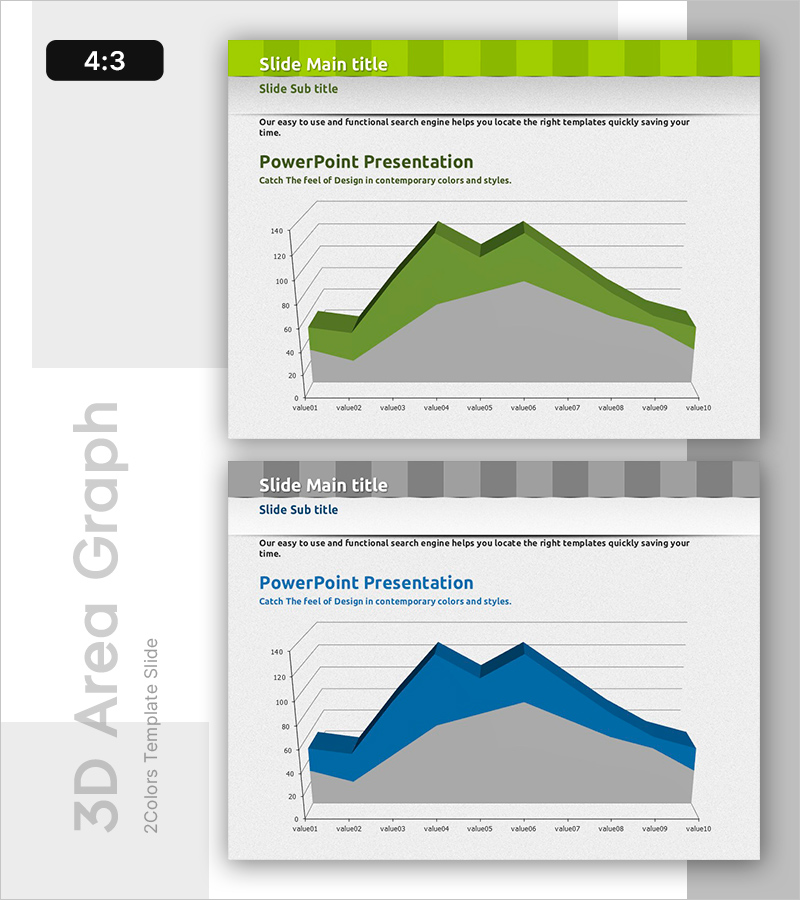
3D Area Chart (Green & Blue) – New Possibilities in Data Visualization
#Graph
-
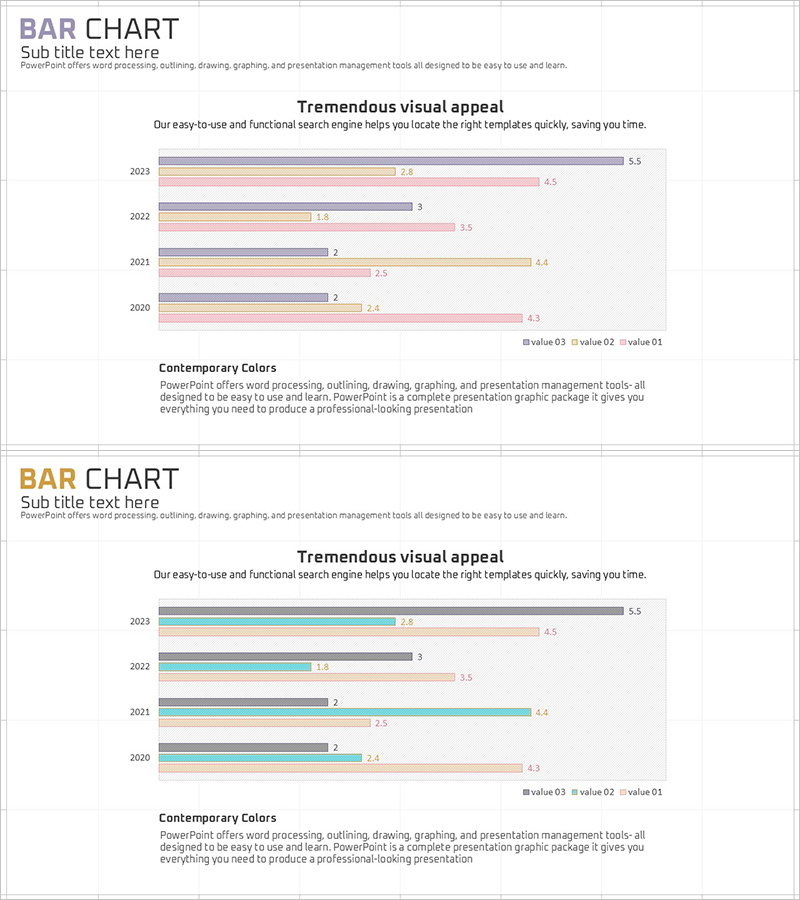
Year-by-Year Comparison Bar Chart – Market Analysis and Competitive Advantage
#Market and Competitor Analysis #Graph #Competitive Advantage
-
Slide Comparing Sales Trends by Year – Data Visualization
#Market and Competitor Analysis #Financial Plans and Performance #Diagram
