Diagram
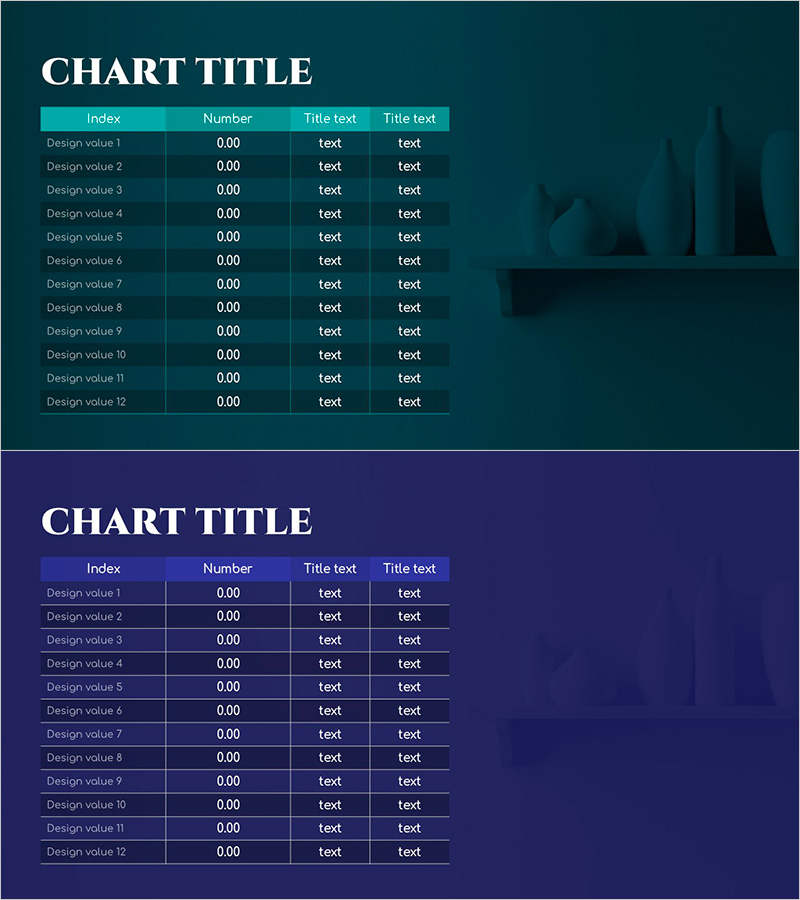
Green Purple Table Chart – Diverse Data Presentation
RJ0900034_13
- Last Update 12/21/2025
- File Size 2.3MB
- # of Slides 2
- File Format PPTX
- Slide Ratio 16:9
- Color
About the Product
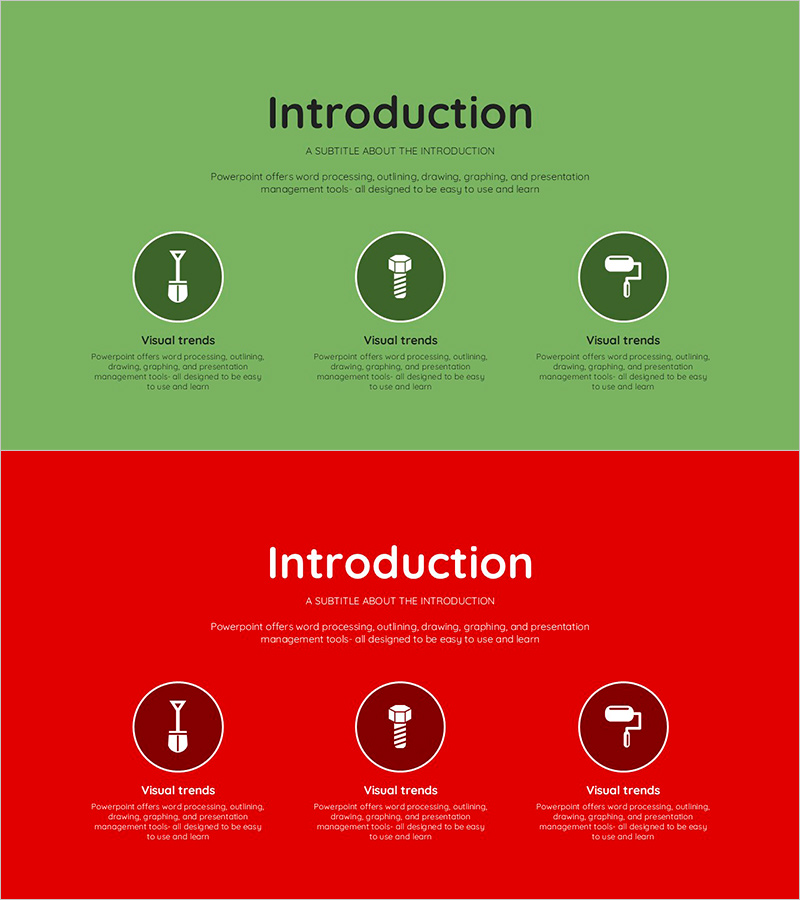
This slide features a table chart that visually represents data using a green and purple color scheme. The modern design and concise layout work in harmony to clearly and easily convey information in reports or presentations. This template is particularly effective for comparing and analyzing data in various situations, such as business meetings, proposals, and project reports. The stable combination of teal, purple, and green colors provides a visual impact while enhancing readability. This slide is easy to edit, allowing quick replacement of text and figures, with an overall editing difficulty rated as 'easy'.
Related Products
-
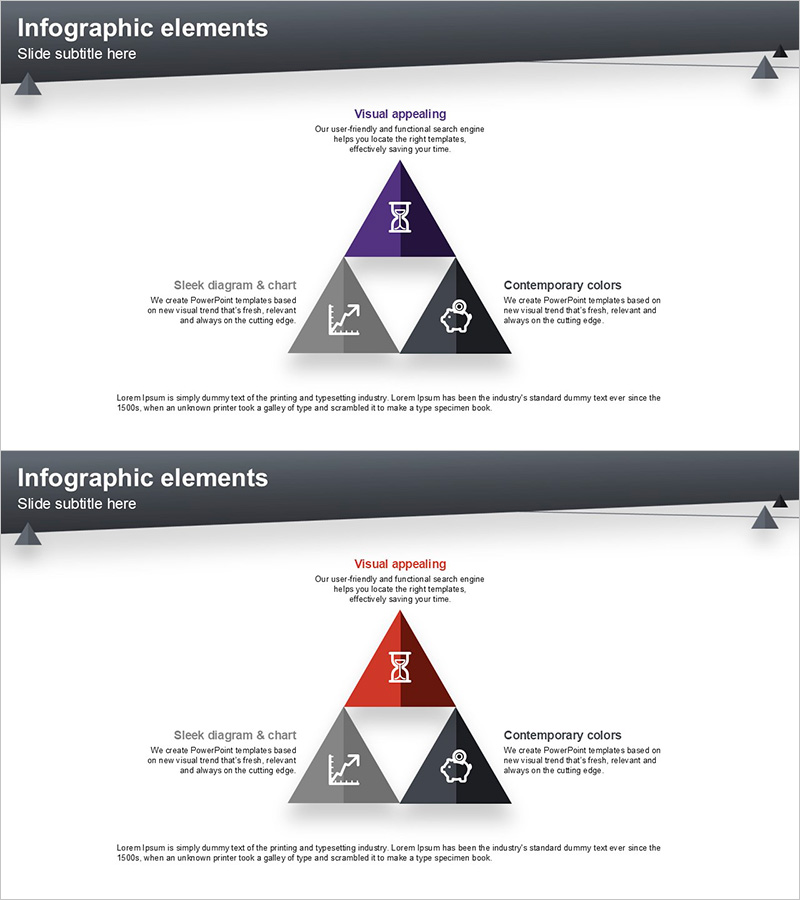
Business Introduction Infographic Slide Template
#Business Introduction #Operation Plan #Diagram
-
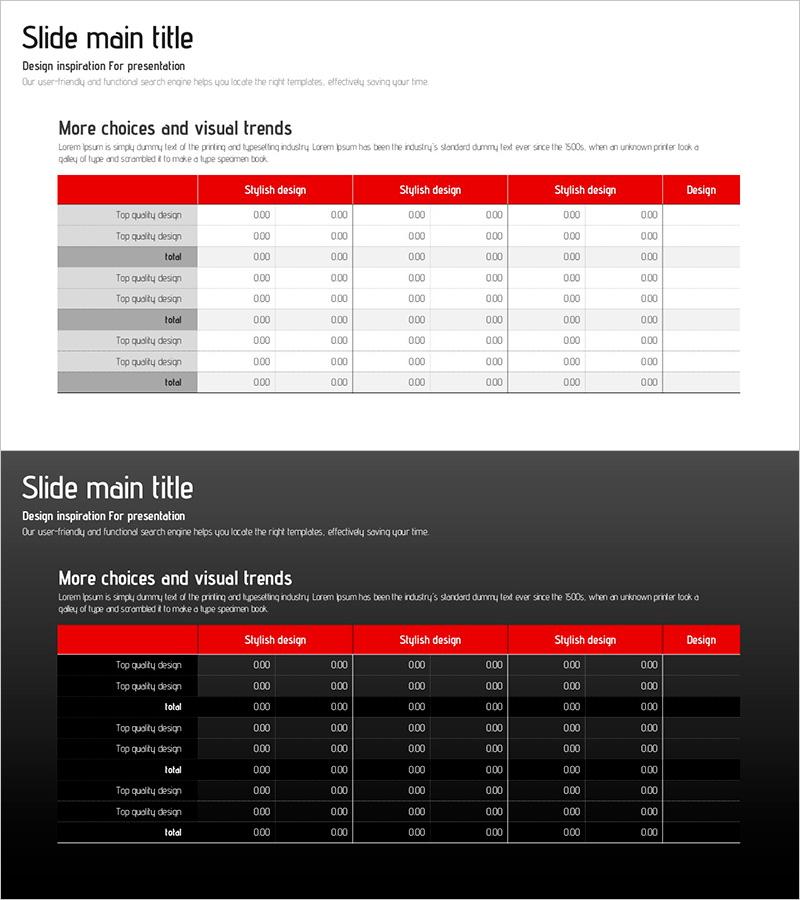
Origami Presentation Template Section Table – Showcase Financial Performance
#Financial Plans and Performance #Diagram #Cash Flow Statement
-
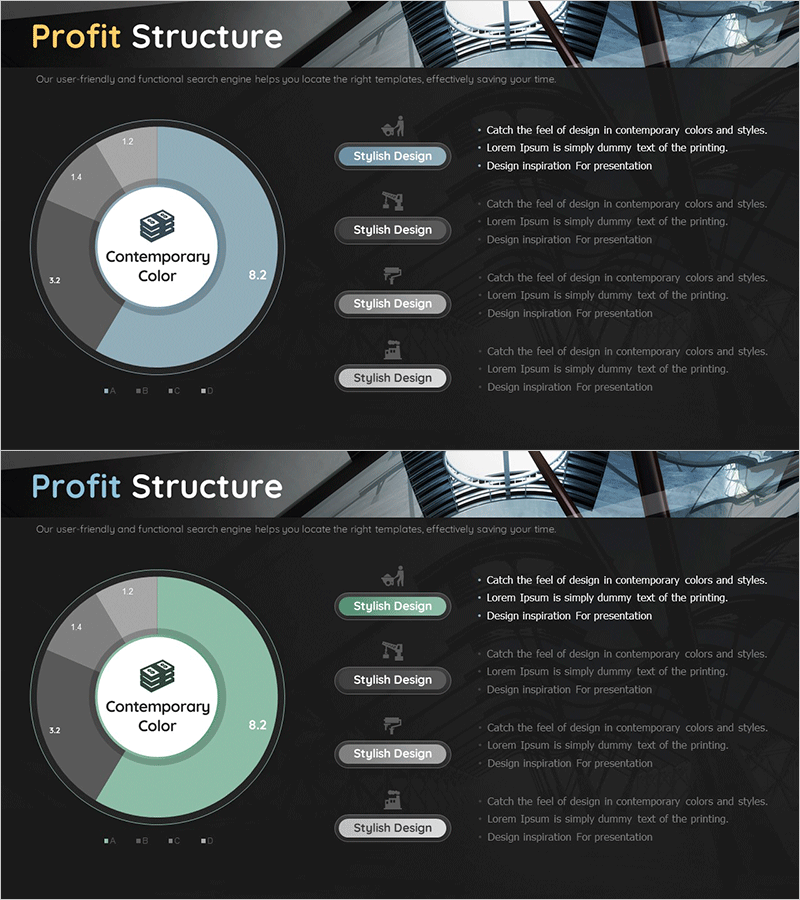
Investment Profit Structure Donut Chart
#Product/Service #Business Introduction #Diagram
-
Introduction to Green Red Product Service – Business Insight
#Company Introduction #Business Introduction #Diagram
