
Market and Competitor Analysis
Regional Demand Survey Graph – Key to Market Analysis
RJ0900028_8
- Last Update 12/21/2025
- File Size 0.3MB
- # of Slides 2
- File Format PPTX
- Slide Ratio 16:9
- Color
Keywords
About the Product
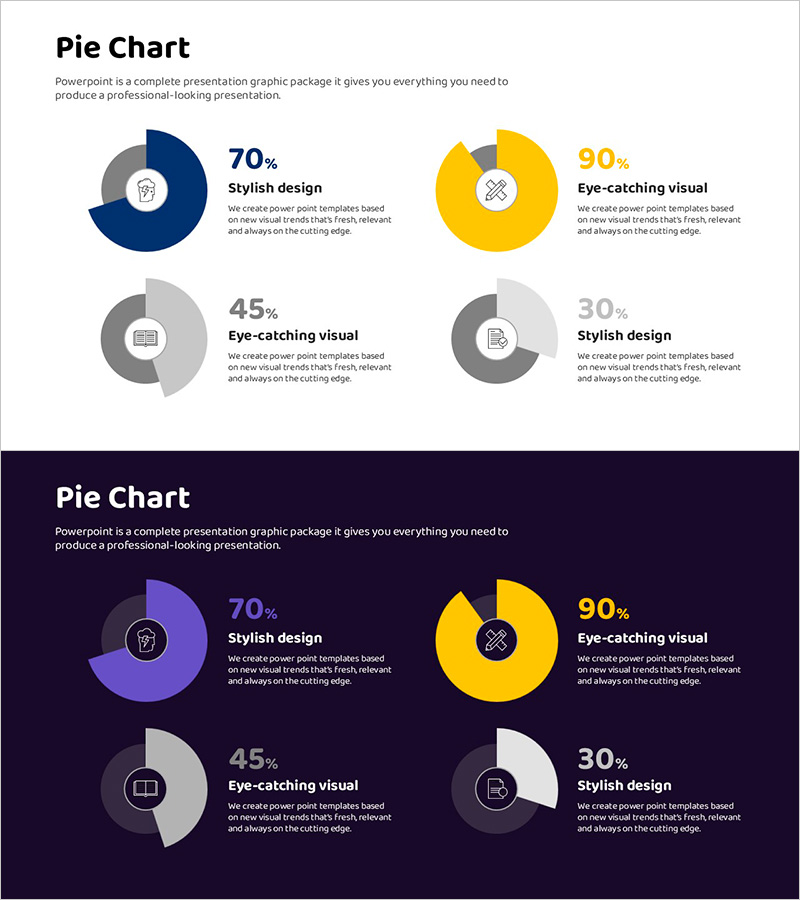
This slide presents a donut chart visualizing regional demand, linking summary data points effectively. With two major values, it optimizes the comparison and understanding of market shifts. The use of strong colors such as red and brown enhances the clarity of the main topic throughout the presentation. It is well-suited for summarizing market analysis and financial performance trends visually. Designed to create a strong impact when presenting business strategies, the slide is easy to edit with a simple structure.
Related Products
-
Idea Market Future Outlook Analysis Chart
#Market and Competitor Analysis #Graph #Future Outlook
-
World Travel Template Horizontal Bar Segment Chart
#Market and Competitor Analysis #Graph #Industry Trends
-
Surgical Drape Theme Broken Line Graph - Competitor Analysis
#Market and Competitor Analysis #Graph #Competitor Analysis
-
Donut Charts in 4 Fields – Effective Performance Visualization
#Company Introduction #Product/Service #Graph
