Business Introduction
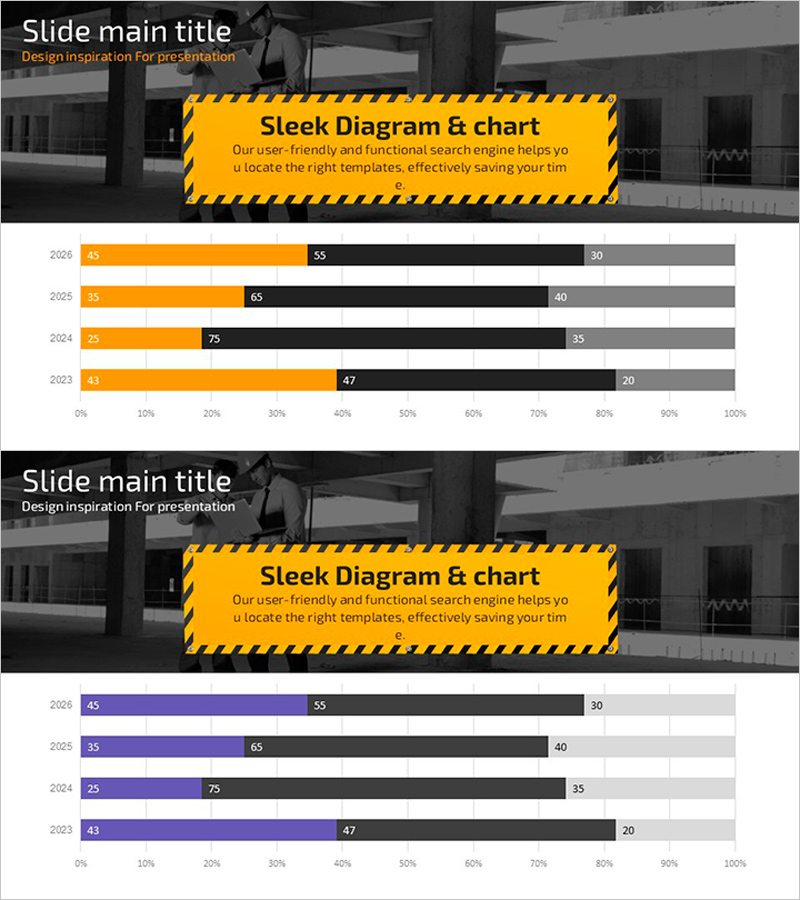
Graphic Analysis of Safety Accidents – Market Insights and Trends
RJ0900018_23
- Last Update 12/21/2025
- File Size 1.4MB
- # of Slides 2
- File Format PPTX
- Slide Ratio 16:9
- Color
Keywords
About the Product
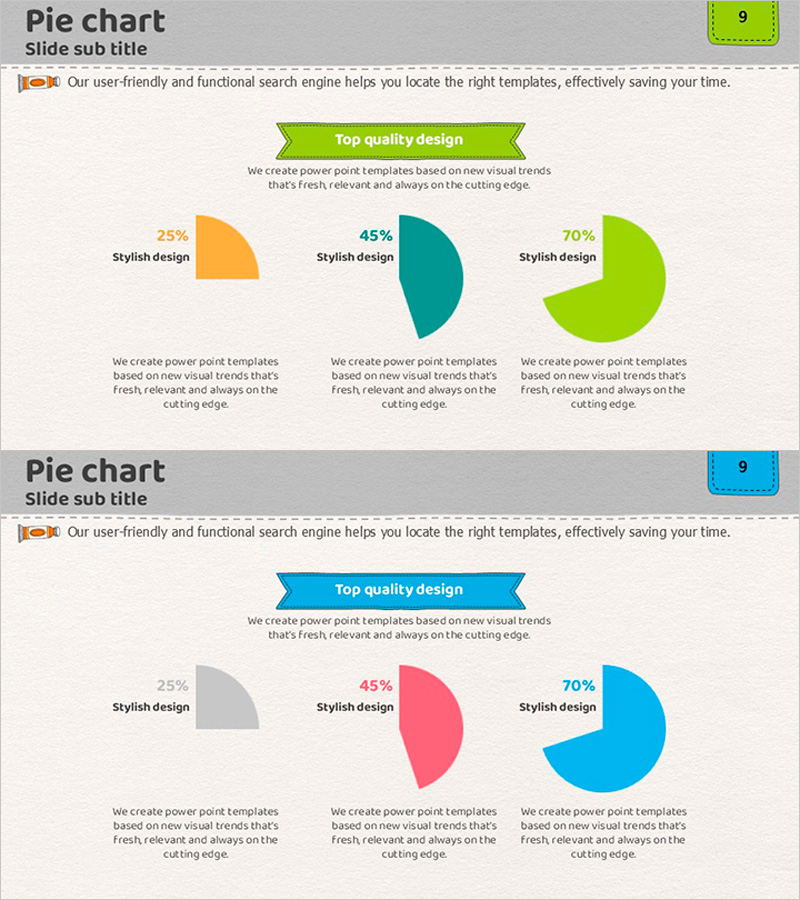
This slide presents safety accident trends using a horizontal bar chart, visually depicting analysis of accident data by year. The colors orange and purple effectively highlight important aspects of the data. It is particularly suitable for business introduction and market & competitor analysis, providing accurate visual representation along with additional information to support decision-making. Both text and data fields are easily replaceable, with a low editing difficulty for rapid deployment.
Related Products
-
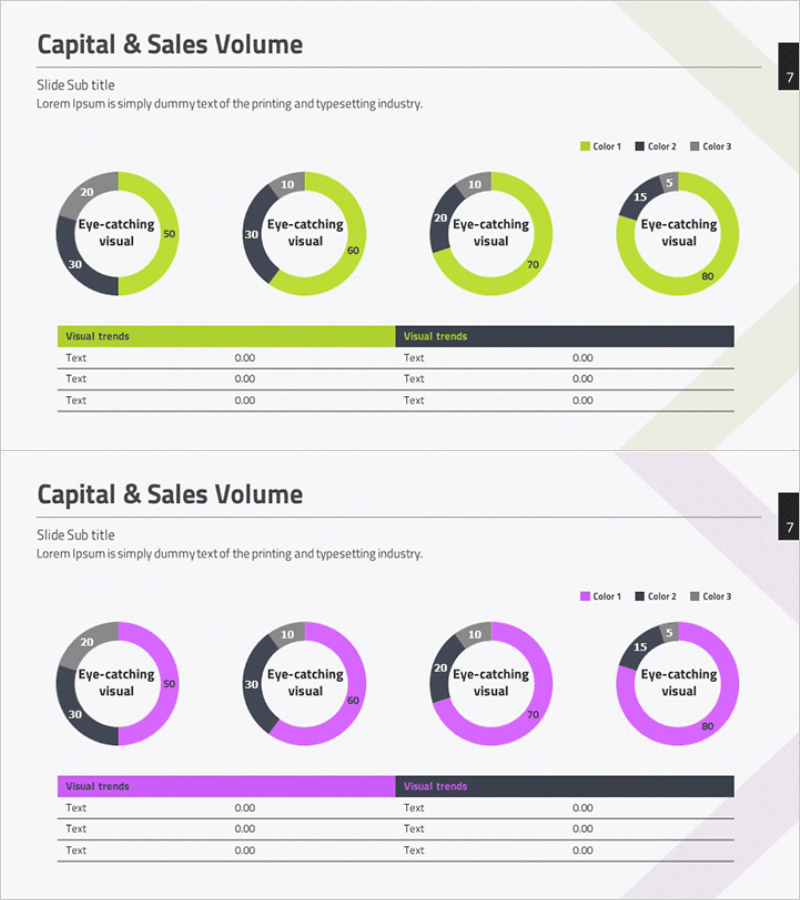
Capital Sales Analysis Graph – Visualizing Financial Performance
#Financial Plans and Performance #Diagram #Graph
-
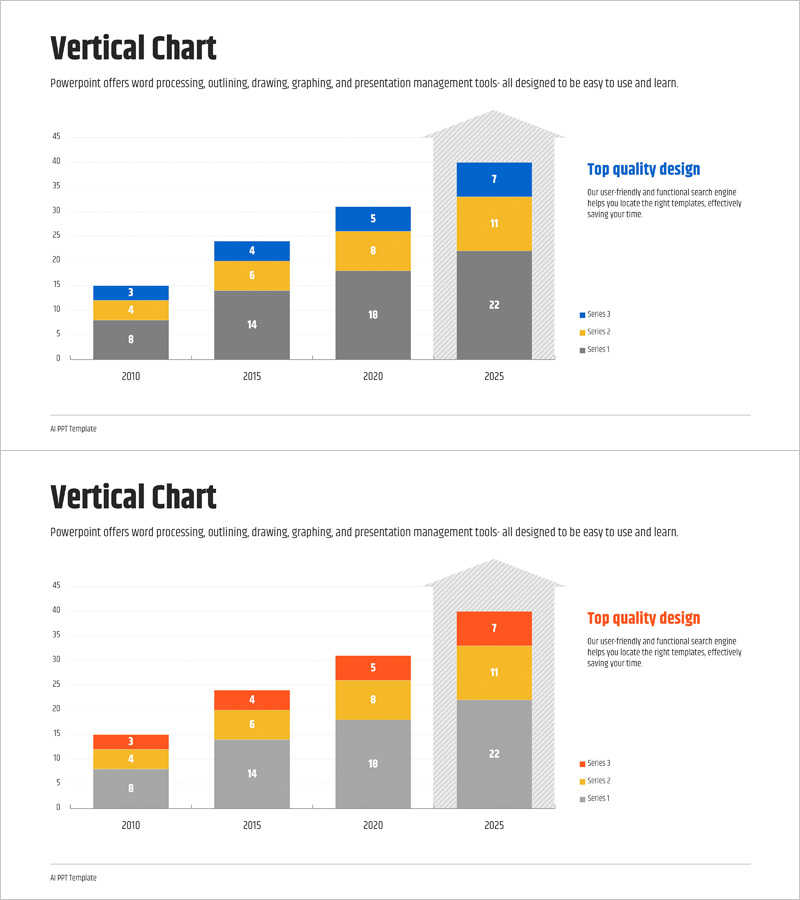
Future Outlook Segmented Bar Graph – Essential Slide for Market Analysis
#Market and Competitor Analysis #Graph #Text Box
-
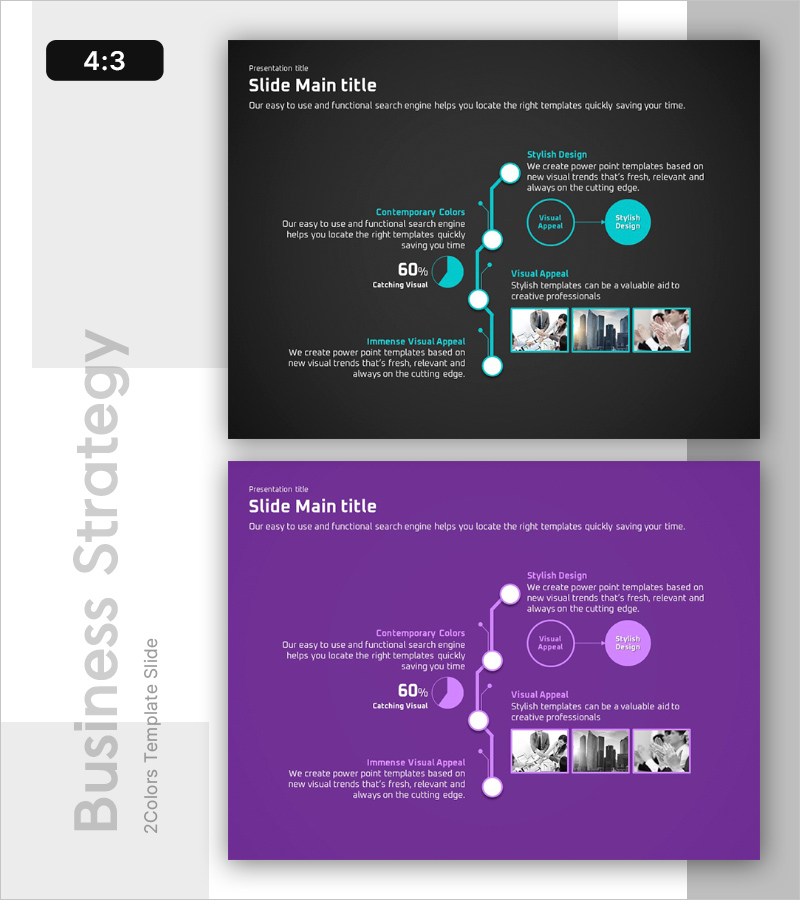
Design Strategies for Next-Gen Mobile Devices – Harmony of Innovation and Design
#Product/Service #Business Vision and Strategy #Diagram
-
Pie Chart for Learning Progress – Optimizing Data Visualization
#Product/Service #Market and Competitor Analysis #Graph
