Business Introduction
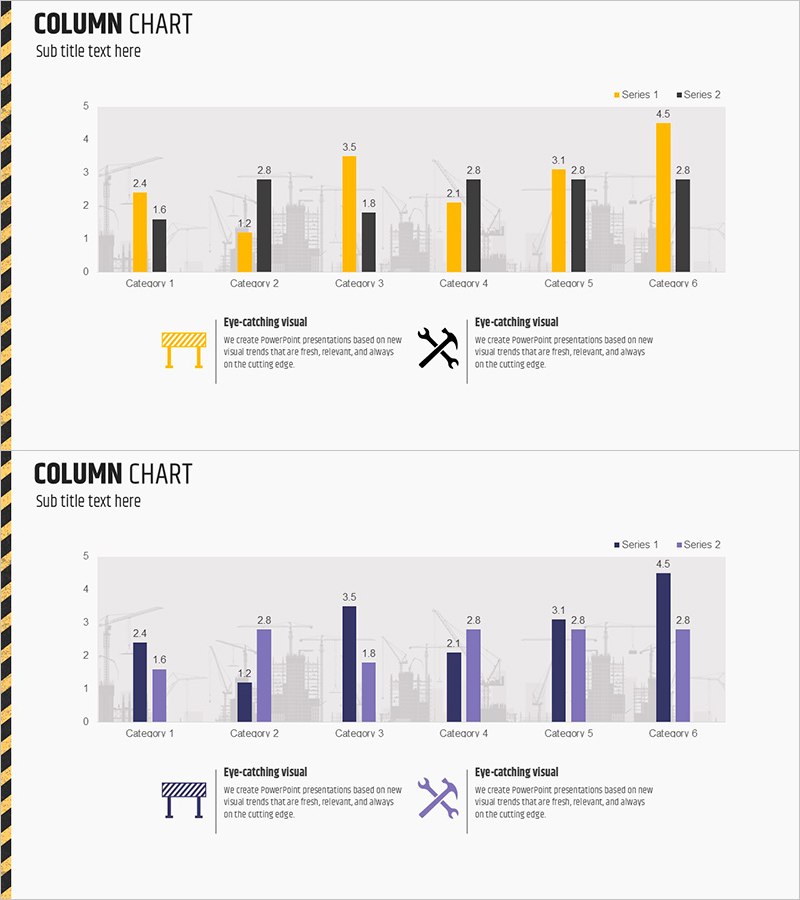
Construction Receivable Trend Graph – Clear Data Comparison
RJ0900011_12
- Last Update 12/21/2025
- File Size 0.3MB
- # of Slides 2
- File Format PPTX
- Slide Ratio 16:9
- Color
Keywords
About the Product
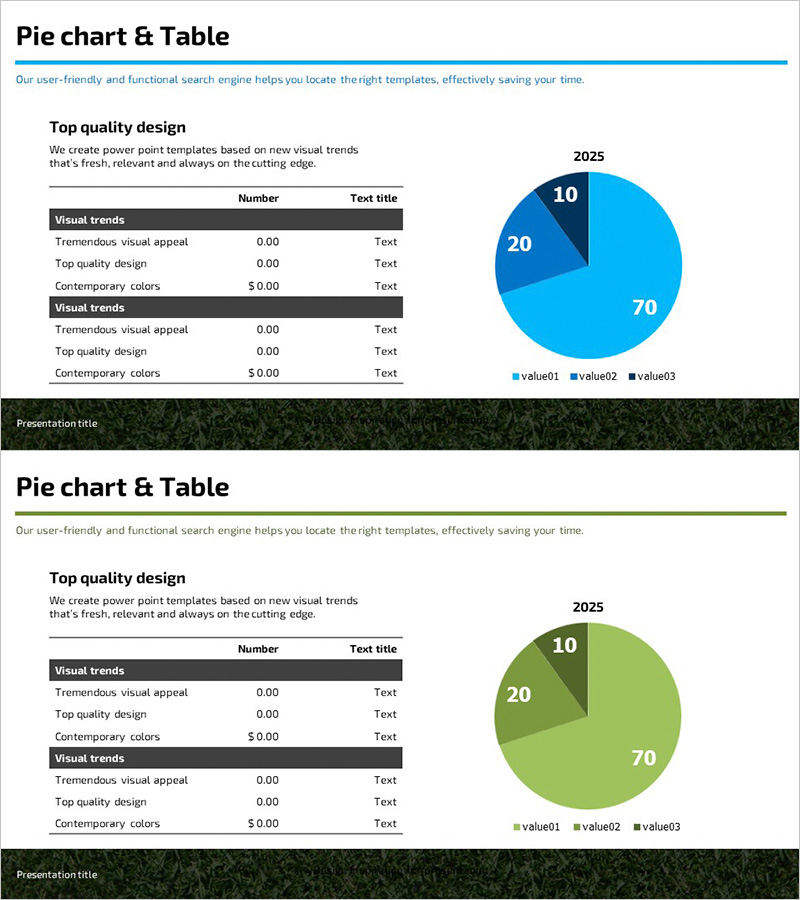
This slide features a trend graph designed for effectively visualizing construction receivables. By utilizing horizontal and vertical bars, it enables clear and intuitive data comparisons, while the contrast of yellow and purple captures attention, emphasizing key points in presentations. It can be used in business introduction materials, status reports, and investment proposals, making it an excellent tool for concise information delivery.
Related Products
-
Competitor and Market Analysis Green Navy Slide
#Market and Competitor Analysis #Graph #Competitor Analysis
-
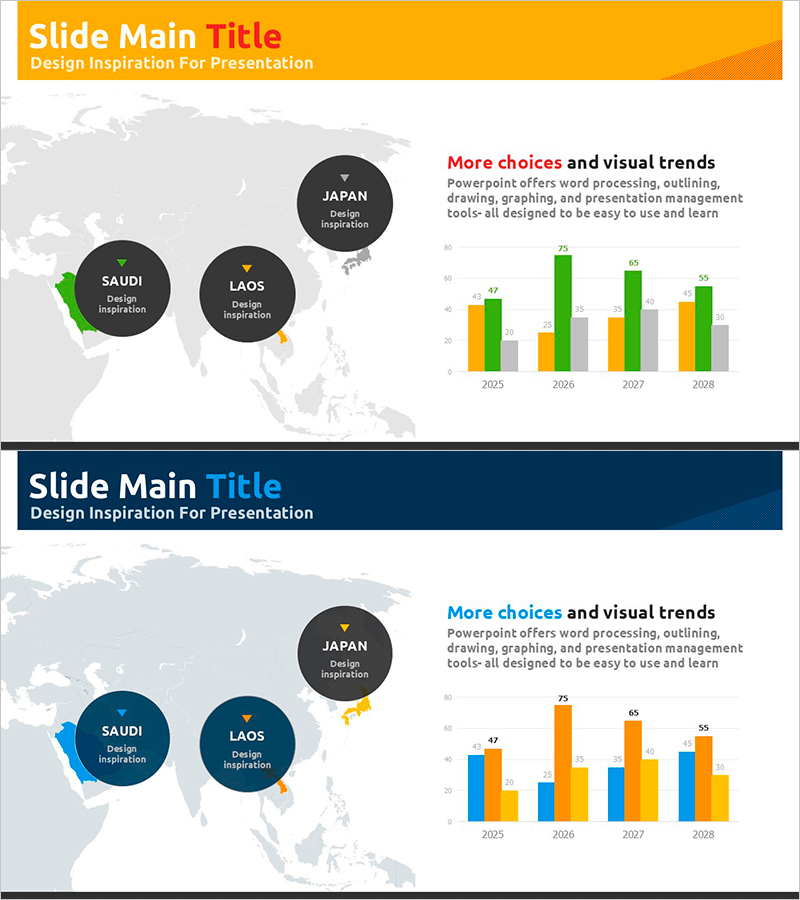
Chart of Change in Sales by Country – Market Analysis and Competitive Advantage
#Market and Competitor Analysis #Graph #Other
-
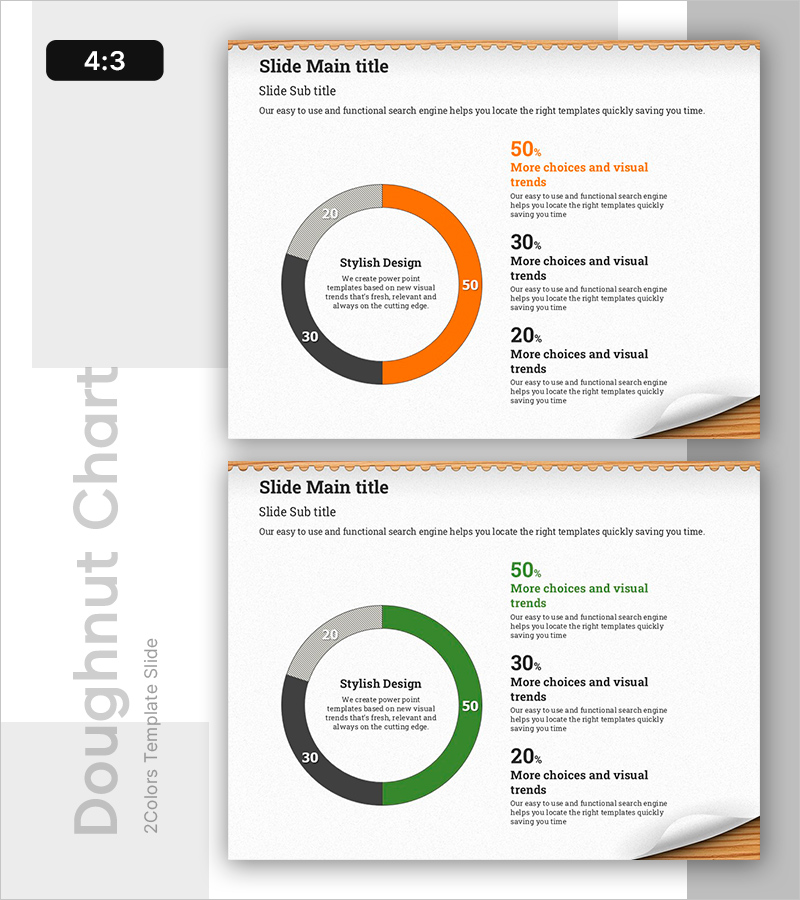
Donut Chart of 3 Items – Visualizing Data at a Glance
#Graph
-
Market Share Pie Chart – Visualized in Blue and Green
#Market and Competitor Analysis #Diagram #Graph
