Market and Competitor Analysis
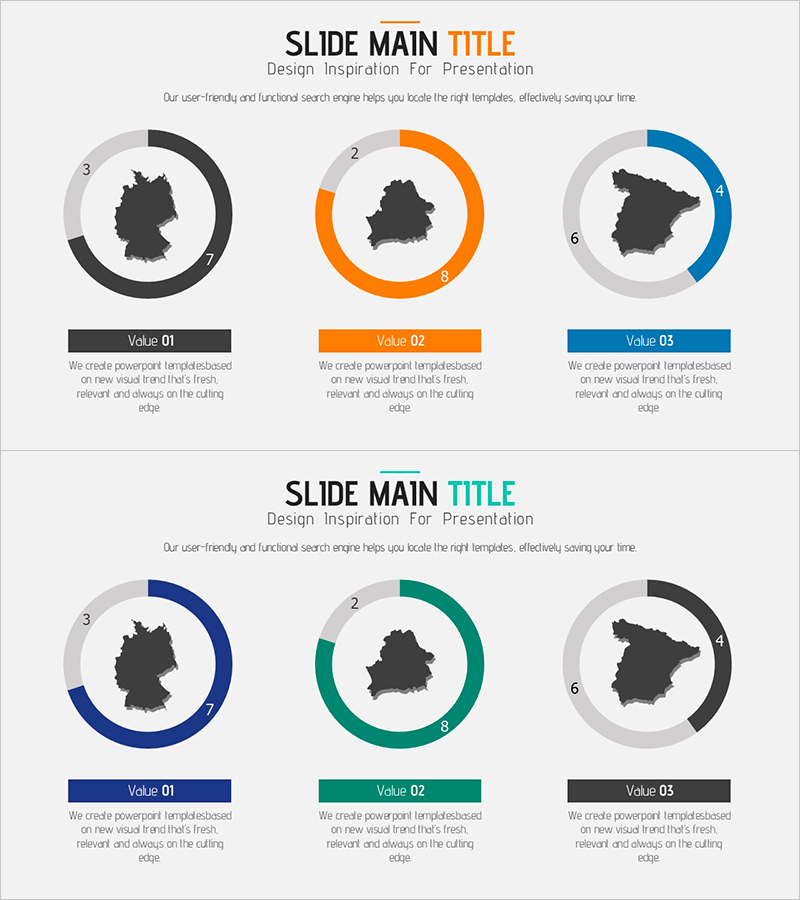
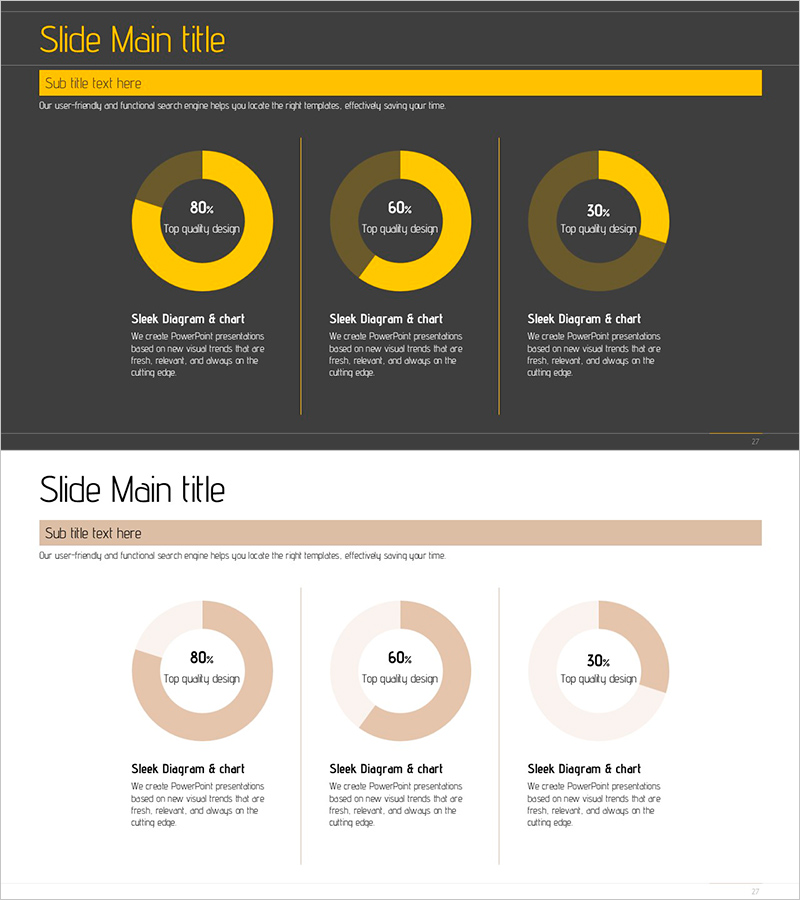
National Analytical Donut Chart – Market Share and Insights
RJ0900010_7
- Last Update 12/21/2025
- File Size 0.4MB
- # of Slides 2
- File Format PPTX
- Slide Ratio 16:9
- Color
Keywords
About the Product
This slide utilizes a donut chart to visually represent market shares by country. The key colors of orange, blue, and green effectively differentiate the data, offering a visually appealing design. Each donut chart displays different market values or shares, making it essential for delivering crucial information in market analysis presentations. This design can be effectively used in business meetings, investment presentations, and team project updates. Text and numbers can be easily replaced, with an editing difficulty rated as 'easy'.
Related Products
-
3 Simple Free Donut Charts – Essential for Data Visualization
#Graph
-
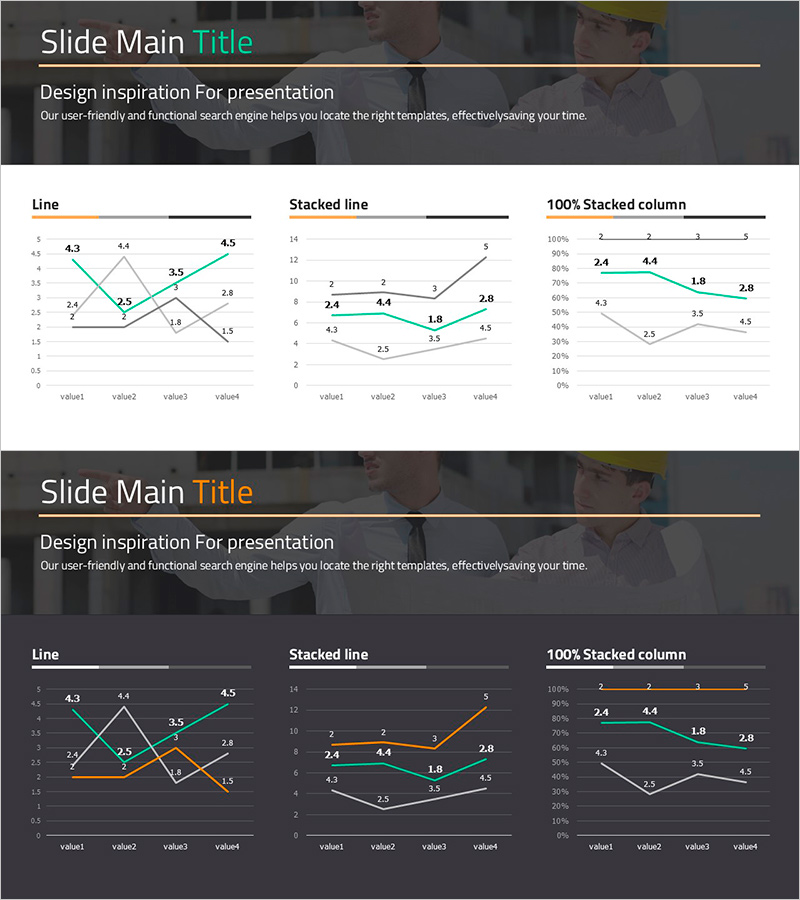
Market Analysis with 3 Line Charts – Data-Driven Future Forecasting
#Market and Competitor Analysis #Graph #Market Status
-
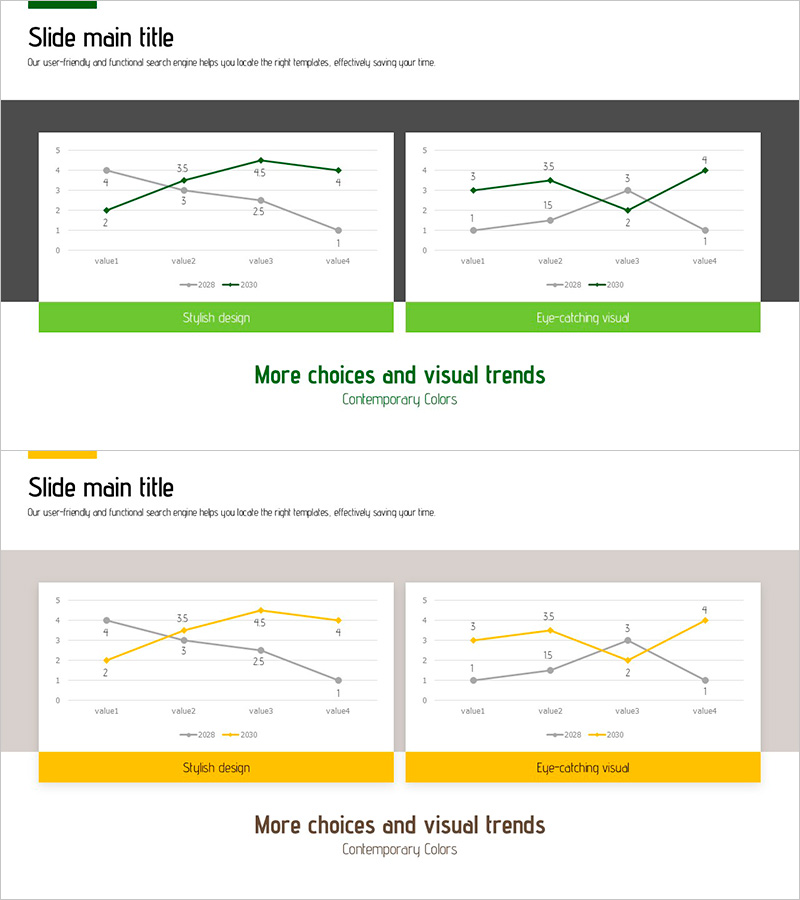
Accumulated Line Chart – Market and Competitor Analysis
#Market and Competitor Analysis #Financial Plans and Performance #Graph
-
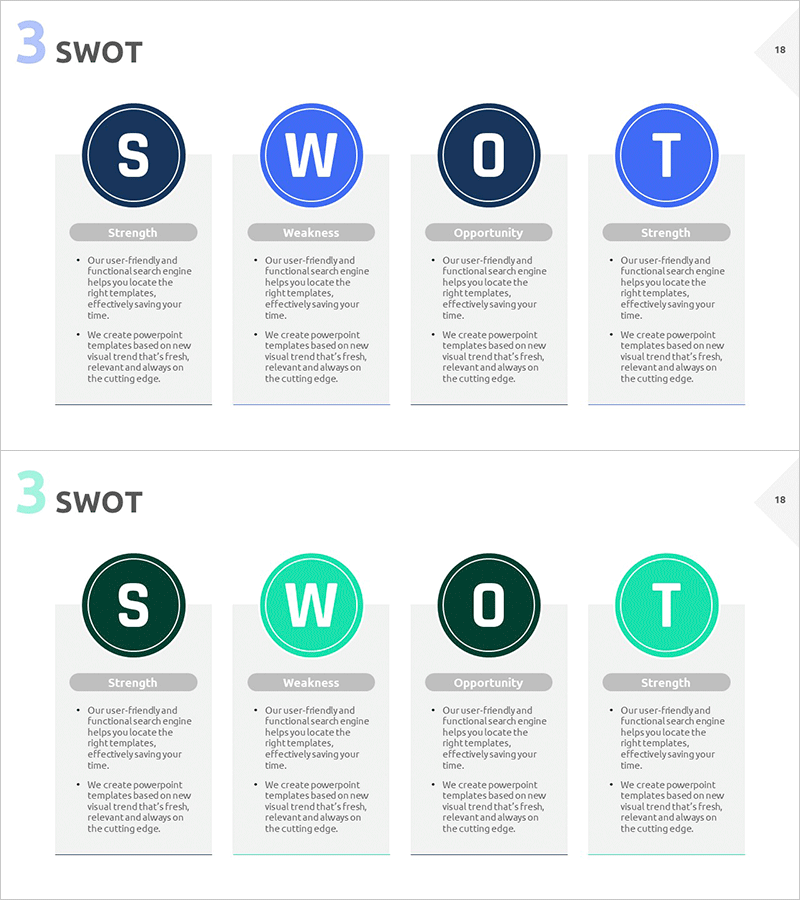
SWOT Analysis Closed Circle Diagram – Market and Competitor Analysis
#Market and Competitor Analysis #Diagram #SWOT Analysis
