Business Introduction
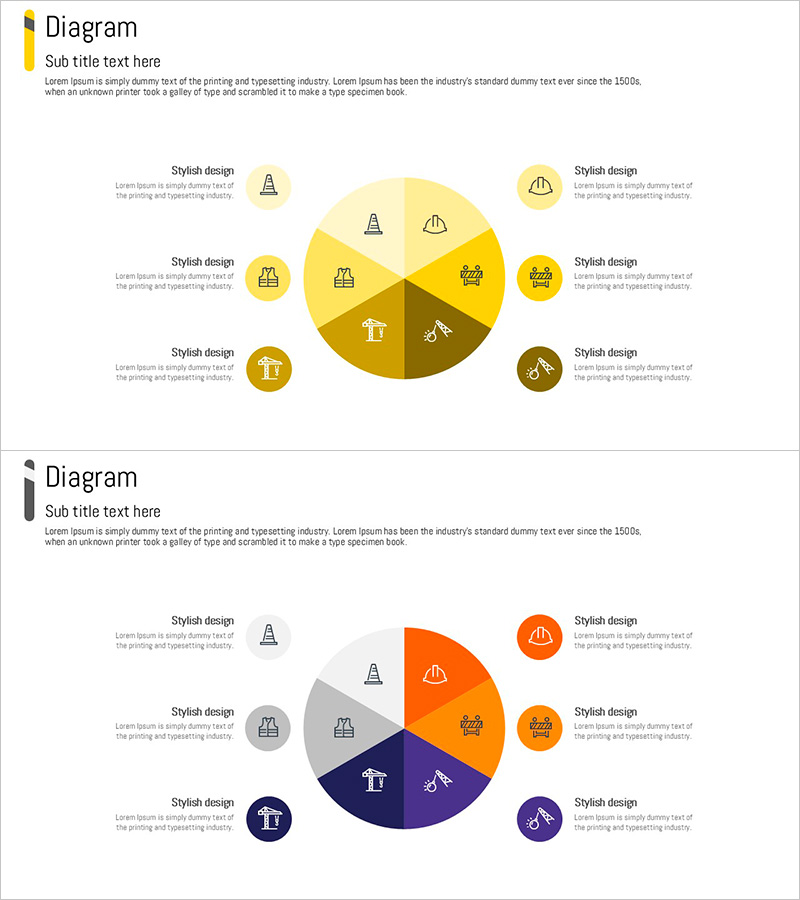
Diagram of the State of Construction Technology – Expanded Business Areas
RJ0900007_18
- Last Update 12/21/2025
- File Size 0.1MB
- # of Slides 2
- File Format PPTX
- Slide Ratio 16:9
- Color
Keywords
About the Product
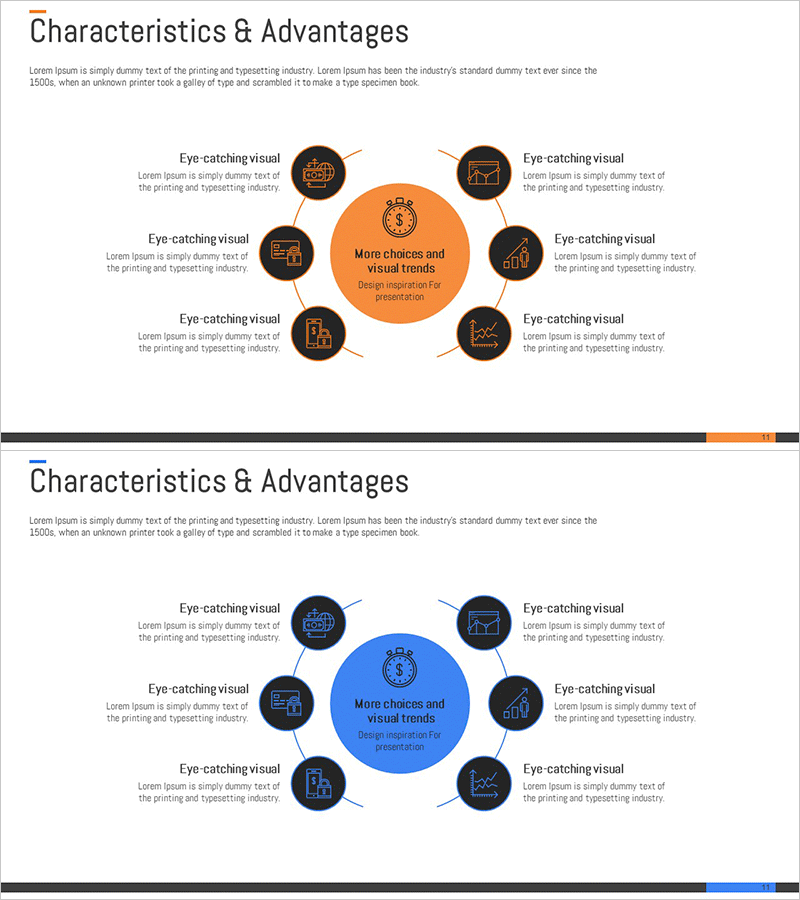
This slide features a diagram that clearly showcases the current state of construction technology. By connecting multiple elements, it visually represents the trends and dynamics of the entire construction industry, employing a decentralized structure to maintain a balanced depiction of various aspects. Utilizing yellow, orange, and purple as the main colors, it adds visual interest and captures the audience's attention. This slide is ideal for business status presentations or technical reports, especially related to projects or technological research. The clean design also allows for easy edits, enabling users to quickly replace necessary data.
Related Products
-
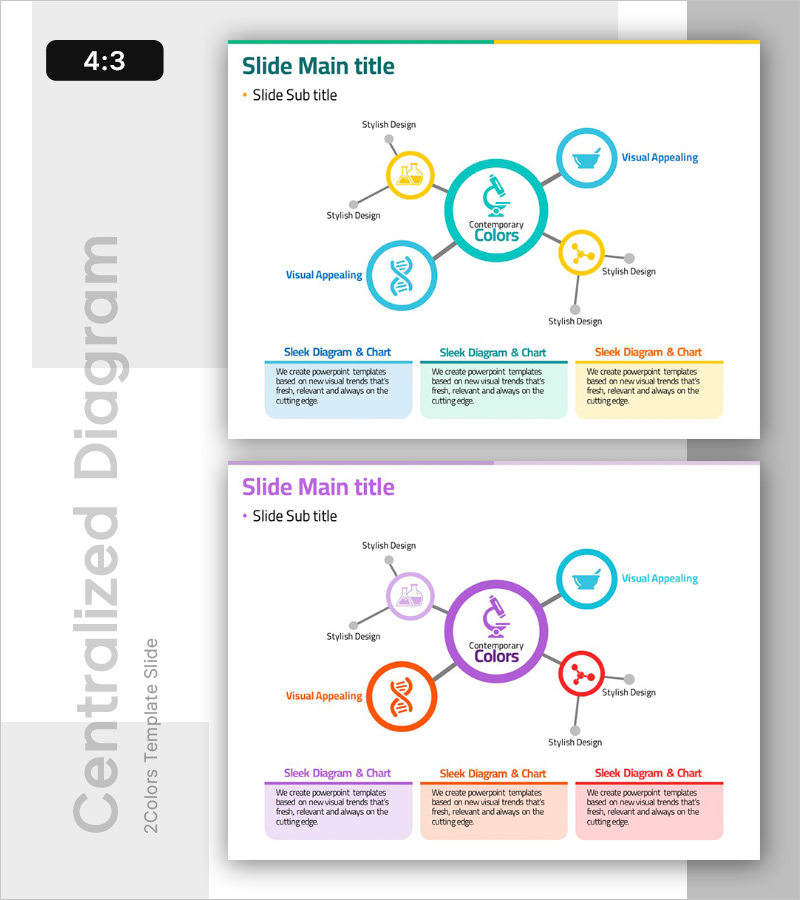
Structural Map of Scientific Components – Effective Infographic Diagram
#Business Introduction #Business Vision and Strategy #Diagram
-
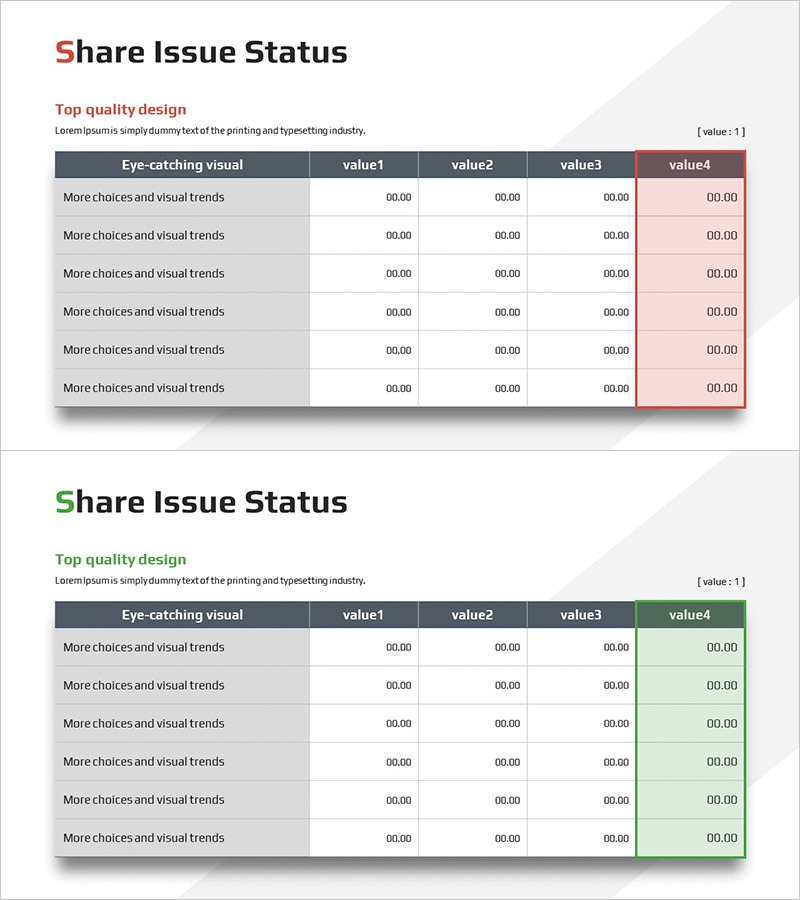
Stock Issuance Status Table – Visualizing Performance Metrics
#Diagram
-
Core Business Goals Diffusion Diagram - Visual Representation of Business Strategy
#Business Introduction #Marketing Plan and Strategy #Diagram
-
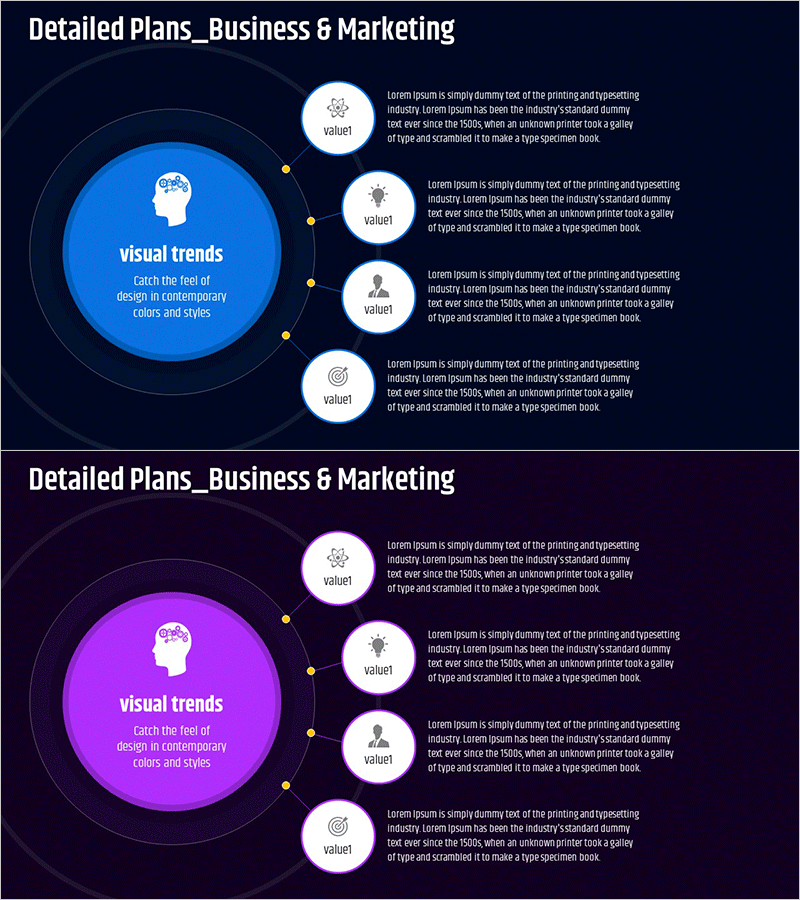
Visualizing Business Sales Growth Characteristics – A Diagram for Effective Understanding
#Product/Service #Diagram #Features
