Structural Map of Scientific Components – Effective Infographic Diagram
RB0300013_6
- Last Update 03/10/2025
- File Size 0.4MB
- # of Slides 2
- File Format PPTX
- Slide Ratio 4:3
- Color
Keywords
- #Content-Based Slides
- #Design-Based Slides
- #Business Introduction
- #Business Vision and Strategy
- #Diagram
- #Infrastructure
- #Core Competencies
- #Spread
- #Centralized Diagram
- #4:3
- #radial diagram PowerPoint
- #hub-and-spoke structure slide
- #6-node diagram template
- #scientific component diagram PPT
- #infographic diagram PowerPoint slide
About the Product
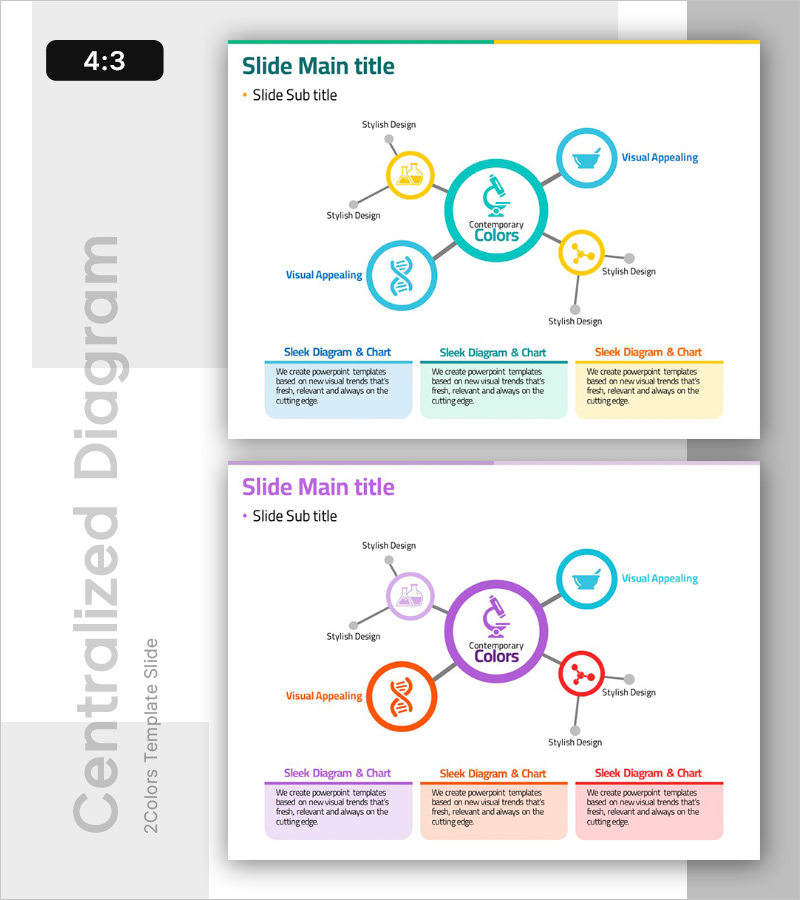
A radial diagram PowerPoint slide featuring a hub-and-spoke structure with one central node and five satellite nodes. The central circle (teal) connects to surrounding nodes in yellow, orange, and teal, each labeled with icons and text. The design uses contrasting colors to establish visual hierarchy and connection lines to show relationships. The 2-slide deck includes a diagram-focused layout on slide 1 and three explanation sections with text boxes on slide 2. This PowerPoint template is ready to use for scientific, technical, organizational, and strategic presentations.
Usage Points
-
Main Usage
Visualizes the relationship between a core concept and surrounding elements, attributes, or stages. The radial structure simultaneously conveys hierarchy and interconnection, making it ideal for explaining scientific components, organizational values with execution strategies, or product features and benefits.
-
How to Use
Slide 1 presents the complete diagram structure; slide 2 divides content into 3 sections with detailed explanations. Replace the central node text and icon with your core concept, then update satellite node labels and icons with corresponding elements or attributes. Use colors to distinguish categories or indicate priority levels.
-
Recommended For
Science and technology presentations (experiment design, system architecture, data structures), business and strategy presentations (core values, business models, organizational structure), product and service introductions (key features, user benefits, technology stack), and educational seminars (concept explanation, process decomposition).
-
Slide Structure
Slide 1: Central circular node (teal with icon) + 5 satellite nodes (yellow, orange, teal with icons) + connection lines and arrows. Slide 2: 3 section text boxes (color-coded headers + description text). 4:3 aspect ratio, PPTX format, fully editable shapes and text.
Related Products
-

Core Competencies for Problem Solving – Business Cluster Diagram
#Business Introduction #Business Vision and Strategy #Diagram
-

Illustration Theme Circular Diagram – Business Domain and Vision
#Business Introduction #Business Vision and Strategy #Diagram
-

Business Core Competency Diffusion Diagram – Effective Strategies Unleashed
#Product/Service Introduction #Business Vision and Strategy #Diagram
-

Mobile Business Overview – Vision and Strategy
#Business Introduction #Business Vision and Strategy #Diagram
