Market and Competitor Analysis
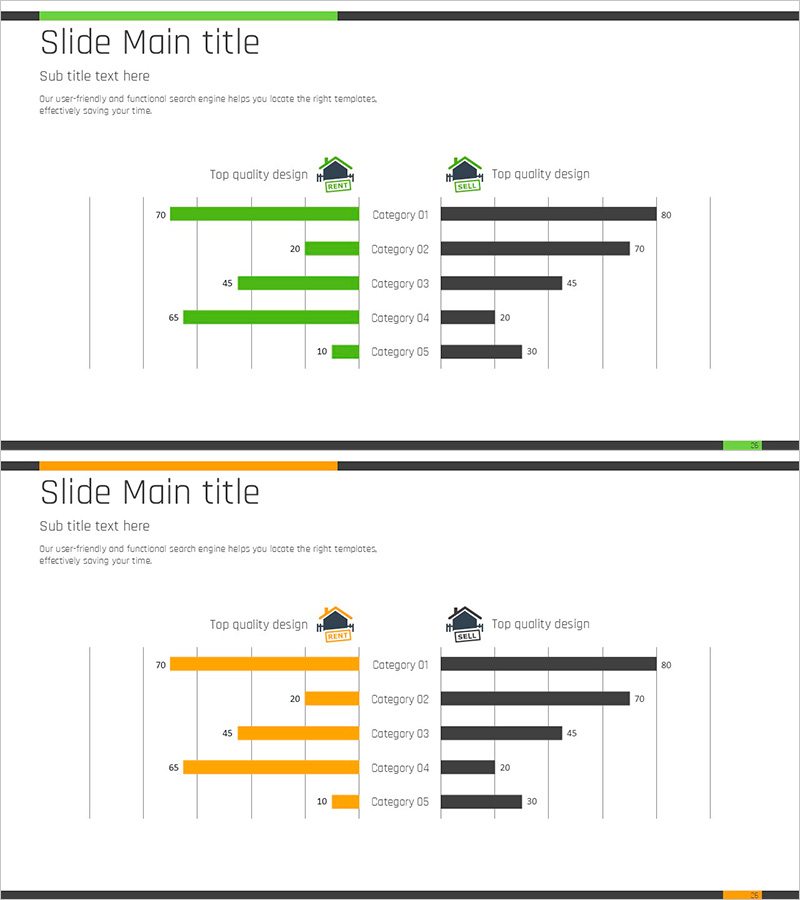
Real Estate Interactive Horizontal Bar Graph – Market Analysis and Performance
RJ0900002_25
- Last Update 12/21/2025
- File Size 0.1MB
- # of Slides 2
- File Format PPTX
- Slide Ratio 16:9
- Color
Keywords
About the Product
This slide presents an interactive horizontal bar graph for real estate market analysis. Its simple and modern design stands out with a harmonious blend of green and orange colors. This template effectively compares financial performance across various real estate categories and is suitable for conveying information on competitive advantages and revenue. It assists not only investors and corporate executives but also the general audience. The ease of replacing text and data results in a moderate editing difficulty, making it ideal for maximizing presentation effectiveness in market status and competitiveness analysis.
Related Products
-
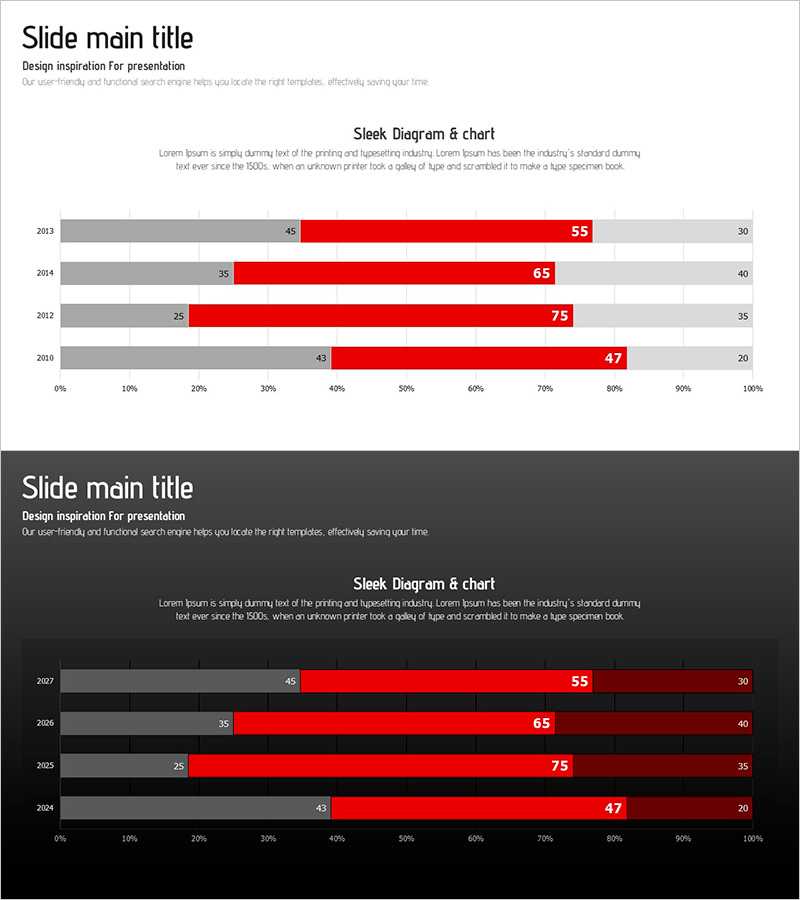
Bar Chart for Market Analysis Visualization – Innovation and Growth
#Business Promotion Strategy #Market and Competitor Analysis #Graph
-
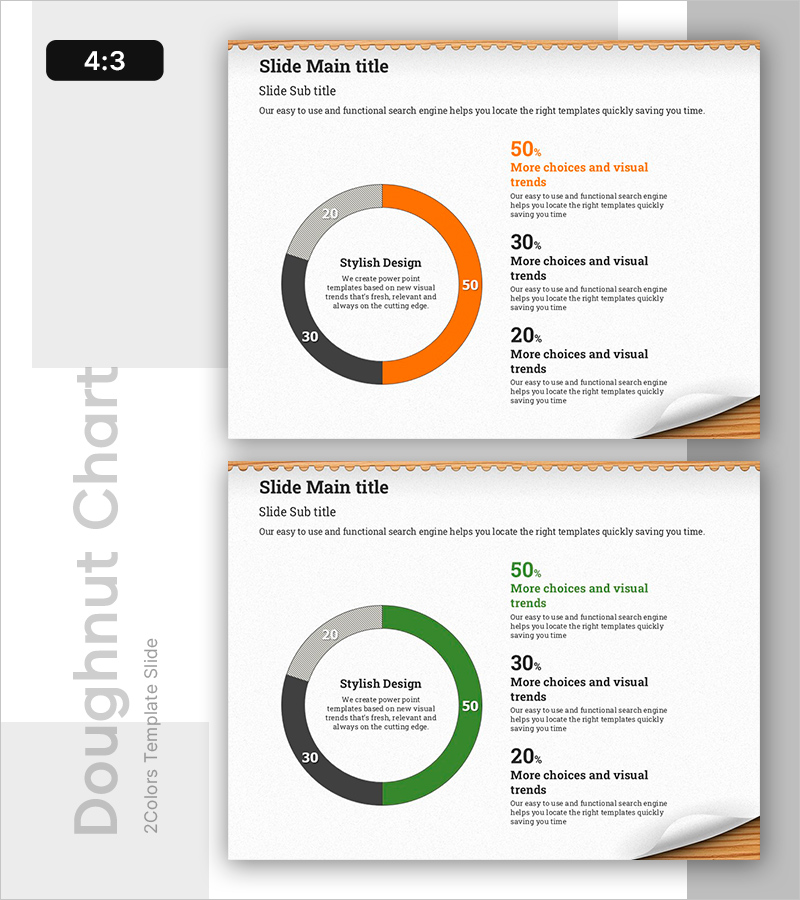
Donut Chart of 3 Items – Visualizing Data at a Glance
#Graph
-
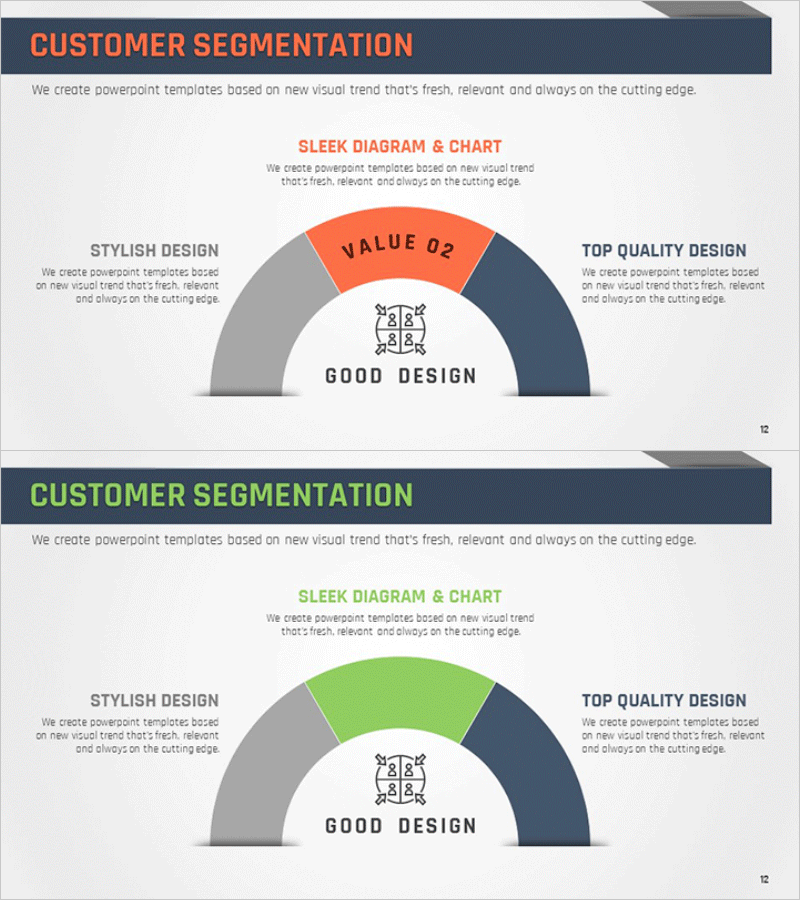
Visualizing Customer Segmentation with Semi-Circular Diagram
#Company Introduction #Market and Competitor Analysis #Diagram
-
Developmental Stages by Age Diagram – Process and Growth
#Product/Service #Market and Competitor Analysis #Diagram
