Business Introduction
Market Research and Trend Segmentation Chart – Effective Market Analysis
RJ0900002_22
- Last Update 12/21/2025
- File Size 2.1MB
- # of Slides 2
- File Format PPTX
- Slide Ratio 16:9
- Color
Keywords
About the Product
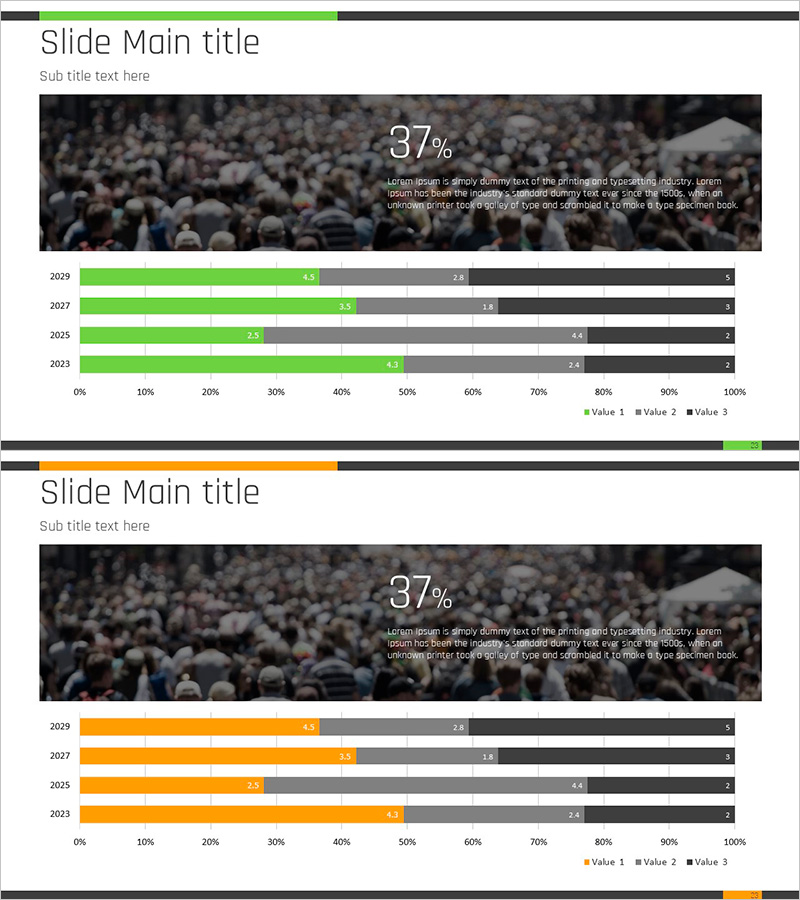
This slide utilizes a horizontal bar graph to visually convey market research findings and trend data in a segmented manner. The harmonious use of green and orange colors presents the data distinctly and impressively, while the concise layout design stands out. Given that the information on trends and market analysis is crucial, this slide is extremely suitable for presentations or reports. The text and data fields are easy to replace, with an overall editing difficulty rated as 'moderate,' making it adaptable across various contexts.
Related Products
-
Business Analysis Chart – Visualizing Competitive Advantage
#Market and Competitor Analysis #Graph #Other
-
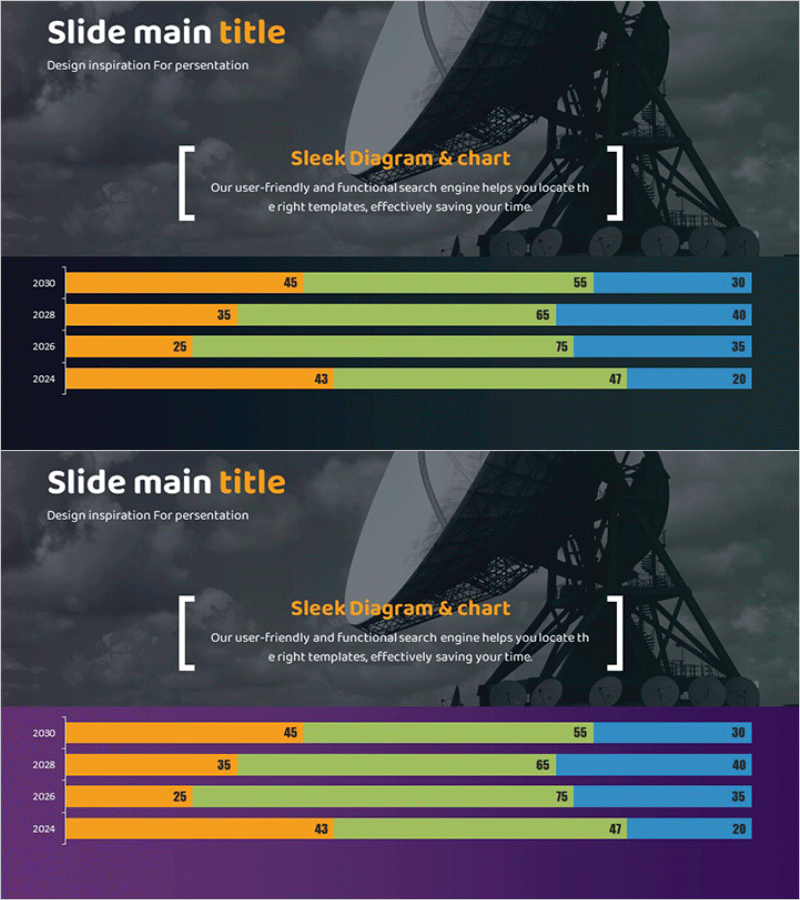
Space Industry Development Status Graph – Key to Market Analysis
#Market and Competitor Analysis #Graph #Competitor Analysis
-
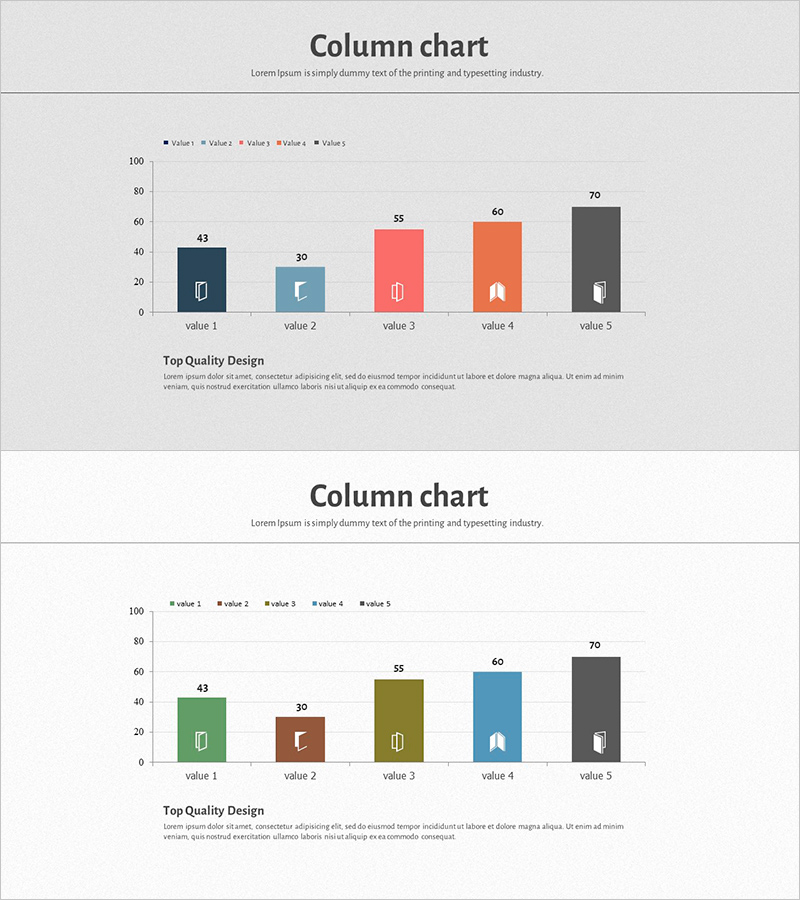
Square Frame Template Column Chart – Business Performance Report
#Business Promotion Strategy #Financial Plans and Performance #Graph
-
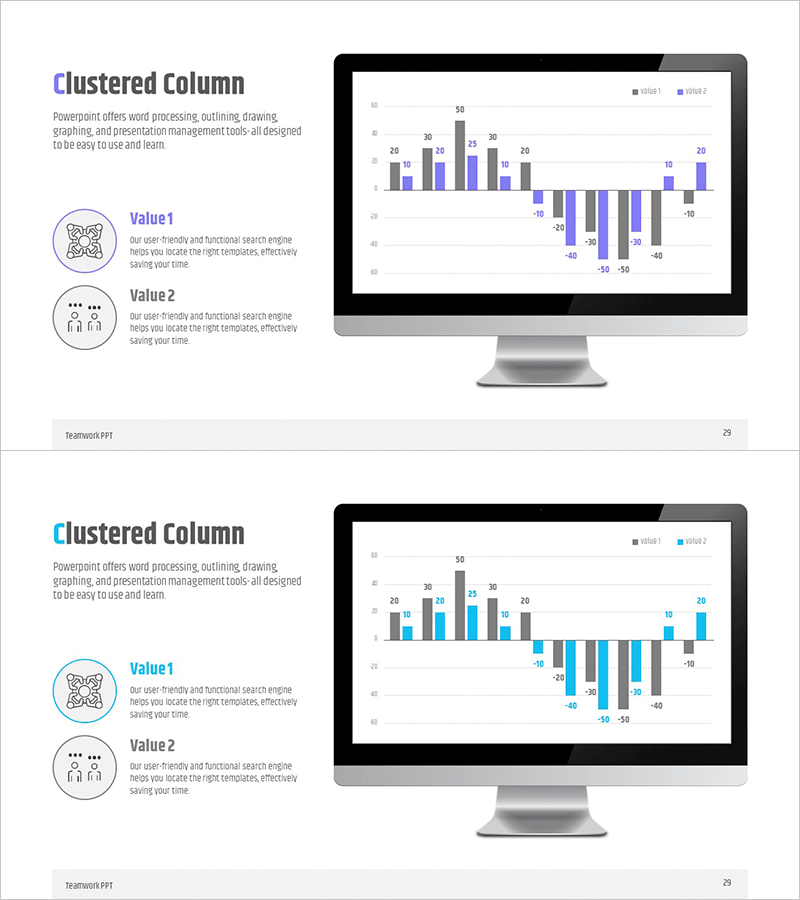
Cluster Diagram Slide for Weakness Analysis
#Market and Competitor Analysis #Diagram #SWOT Analysis
