Business Promotion Strategy
Comparative Graph of Economic Growth – Performance Analysis and Future Prospects
RJ0800037_14
- Last Update 12/21/2025
- File Size 0.2MB
- # of Slides 2
- File Format PPTX
- Slide Ratio 16:9
- Color
Keywords
About the Product
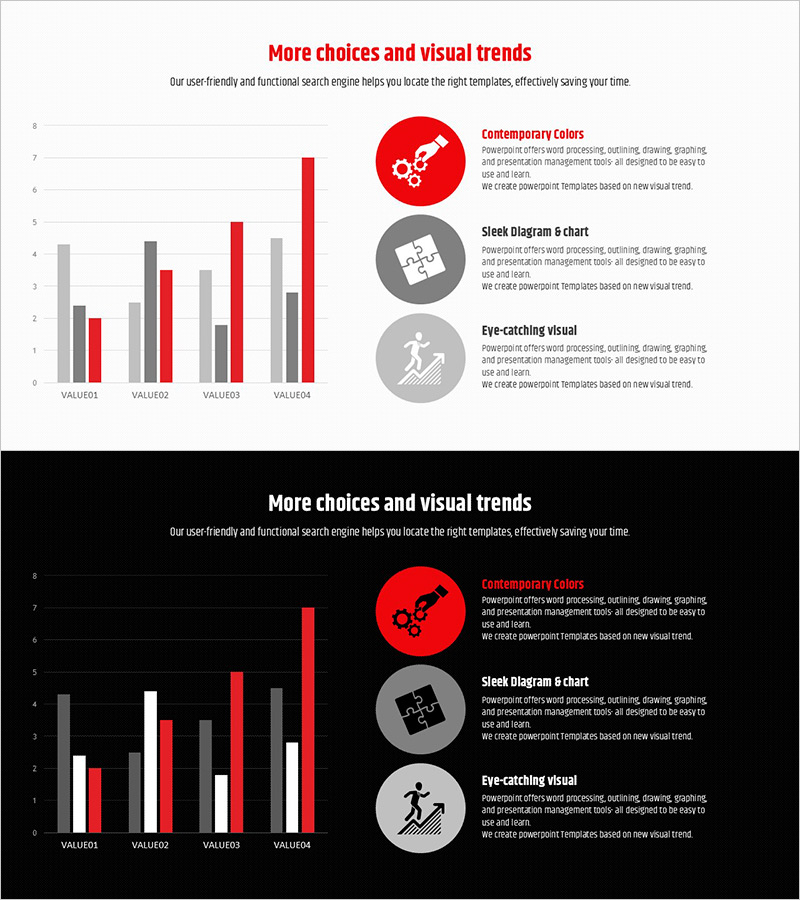
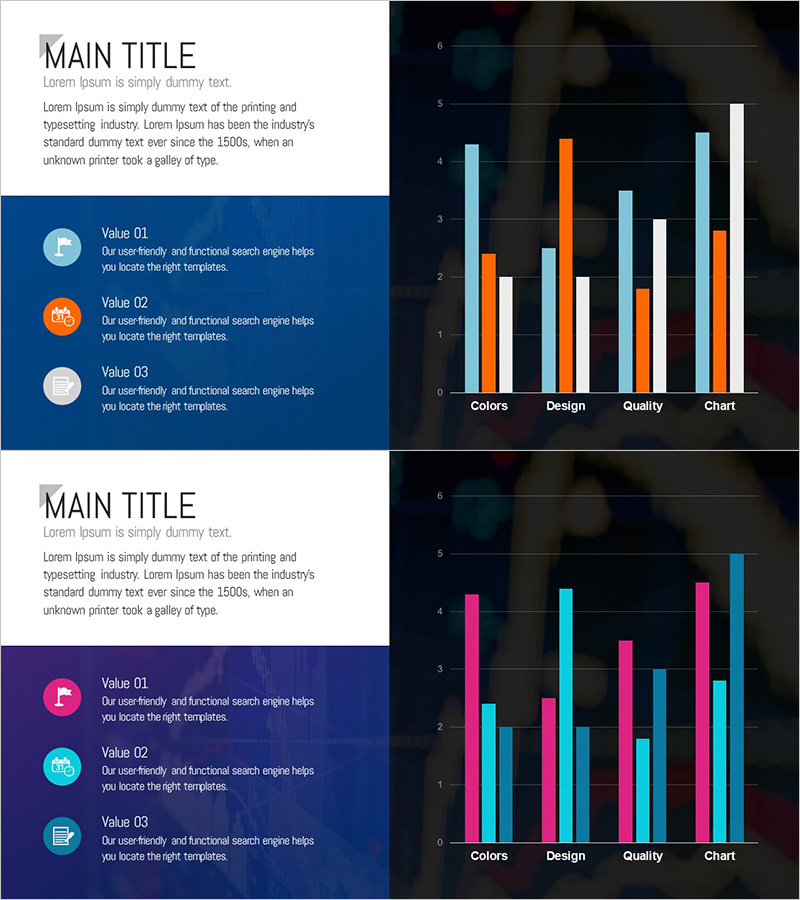
This slide features a comparative graph of economic growth using horizontal and vertical bar charts. With a striking contrast between red and gray, the design allows for intuitive data comparison through a clear grid layout. It is particularly suitable for illustrating business strategies and future performance expectations. The template enables easy text modification for corporate reports or presentations, and the overall editing difficulty is rated as 'easy'.
Related Products
-
Global Target Market Strategy – Effective Presentation for Market Analysis
#Company Introduction #Market and Competitor Analysis #Other
-
Graph Slide Visualizing Average Monthly Eating Out Consumption Trends
#Market and Competitor Analysis #Financial Plans and Performance #Graph
-
Target Market Analysis Bar Graph – Visualizing Market Strategies
#Market and Competitor Analysis #Marketing Plan and Strategy #Graph
-
Clustered Vertical Bar Graph Slide – Visualizing Market Analysis
#Market and Competitor Analysis #Diagram #Graph
