Market and Competitor Analysis
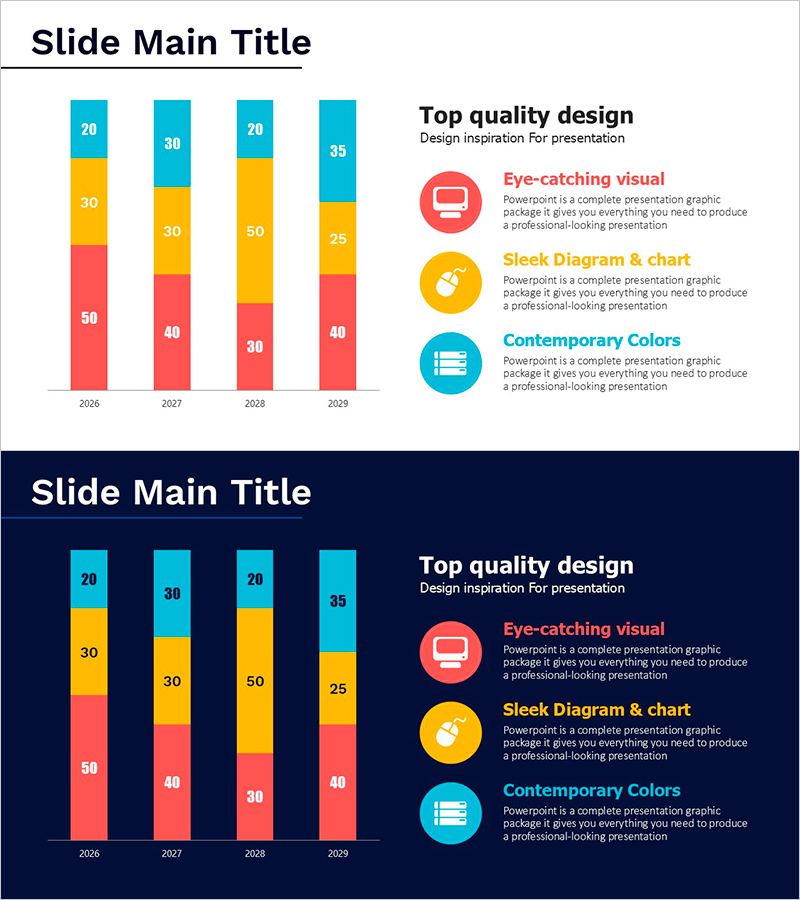
Graph of Changes in Media Utilization
RJ0800026_22
- Last Update 12/21/2025
- File Size 0.4MB
- # of Slides 2
- File Format PPTX
- Slide Ratio 16:9
- Color
Keywords
About the Product
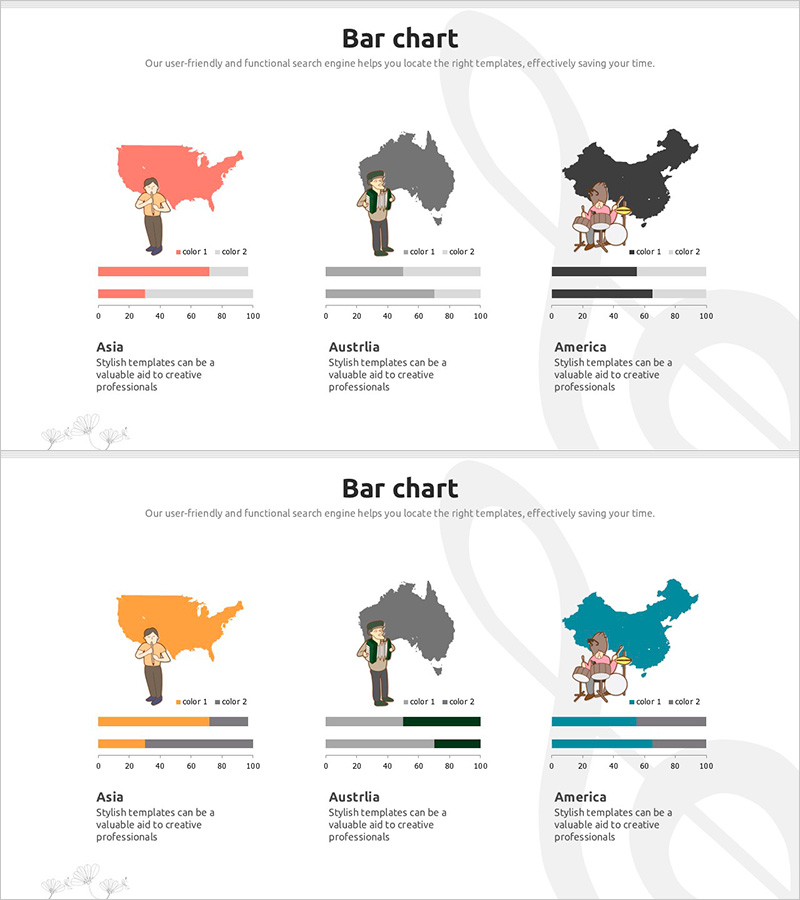
This slide features a horizontal bar chart visualizing changes in media utilization. Designed for easy comparison of data across years, it is suitable for corporate market analysis documents and competitor review reports. The modern color palette of red, turquoise, and yellow enhances engagement, offering clear communication of the information presented. The slide effectively illustrates future prospects, helping the audience gain a clear understanding. Text and data fields are easily replaceable, with an editing difficulty rated as 'easy'.
Related Products
-
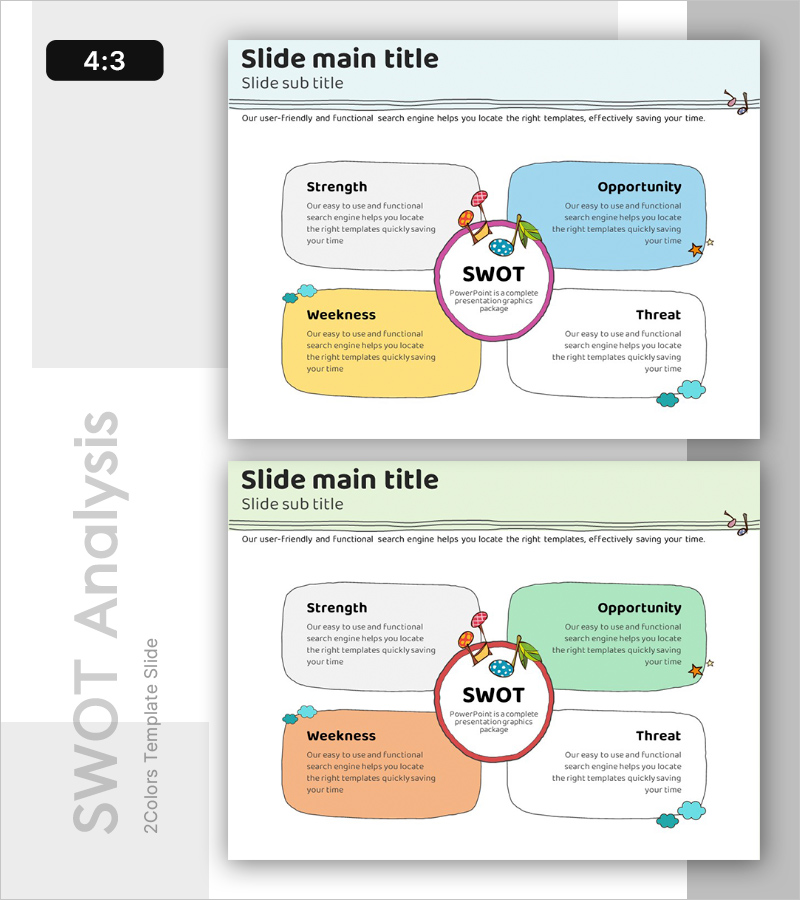
SWOT Analysis of Children's Music Activities – Effective Strategy Development
#Market and Competitor Analysis #Diagram #SWOT Analysis
-
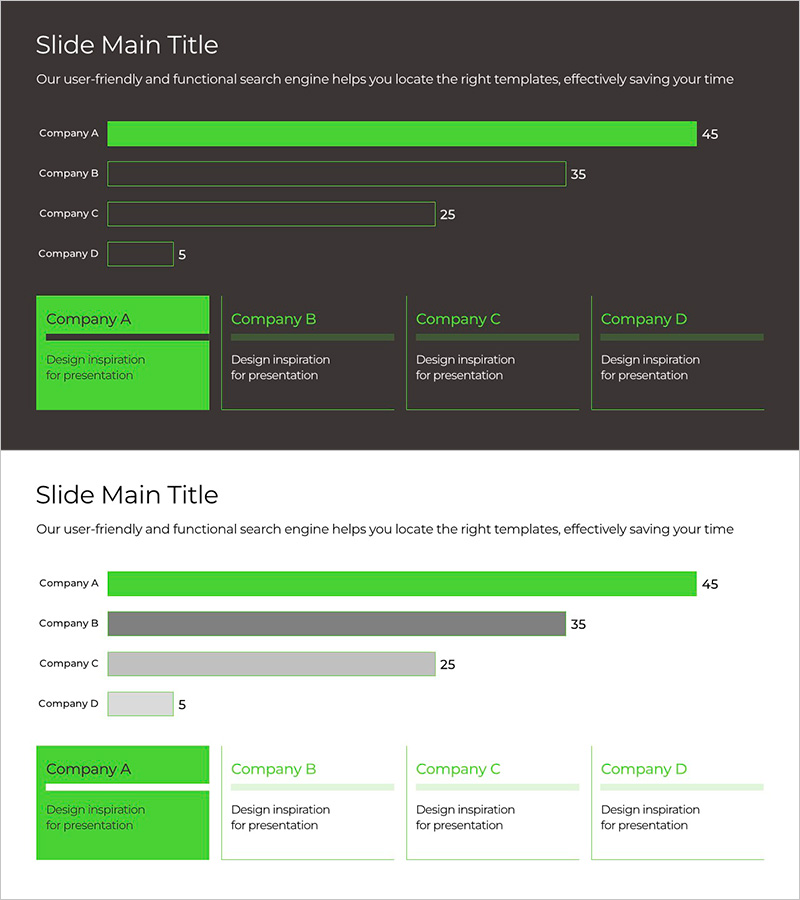
Green & Gray Horizontal Bar Chart – Market Analysis and Competitive Edge
#Market and Competitor Analysis #Graph #Competitor Analysis
-
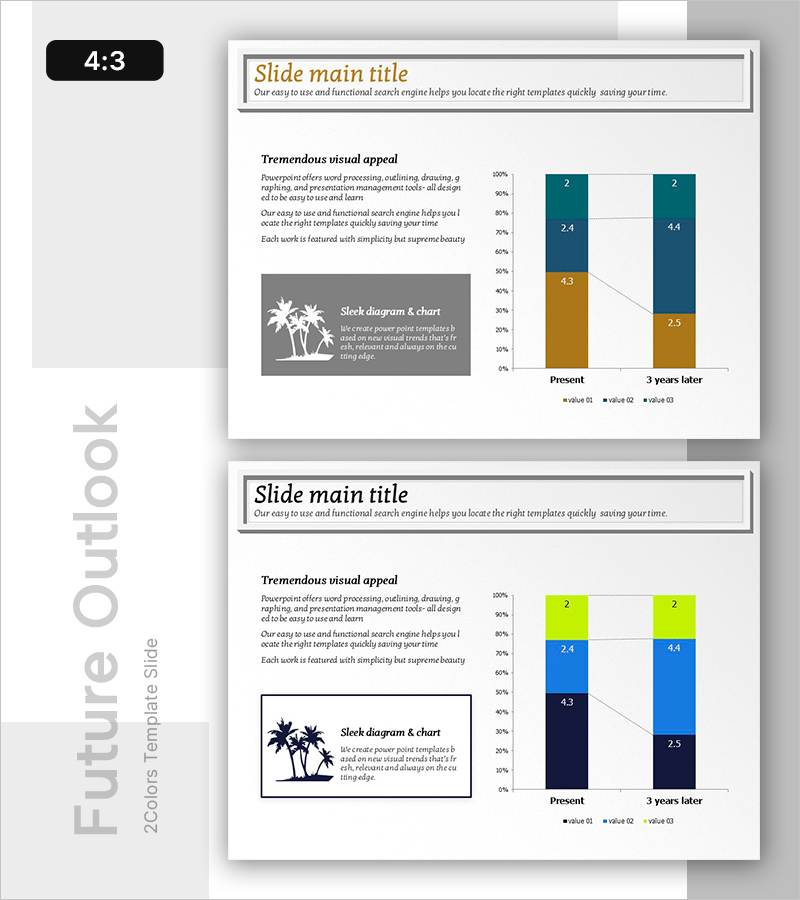
Visualizing Hawaii Travel Demand Forecast with Graphs
#Market and Competitor Analysis #Graph #Future Outlook
-
Analysis of Performers by Country - Horizontal Bar Chart Template
#Company Introduction #Business Management #Graph
