Graph
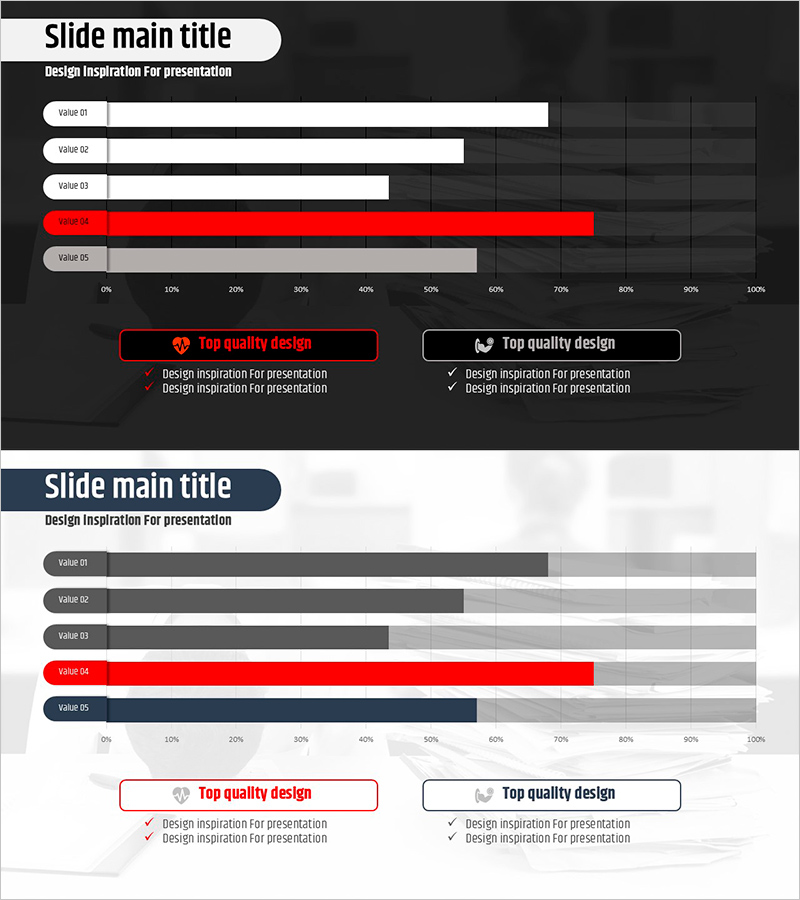
A Change in One's Daily Life After Exercising – Visualizing Lifestyle Changes
RJ0800025_18
- Last Update 12/21/2025
- File Size 1MB
- # of Slides 2
- File Format PPTX
- Slide Ratio 16:9
- Color
Keywords
About the Product
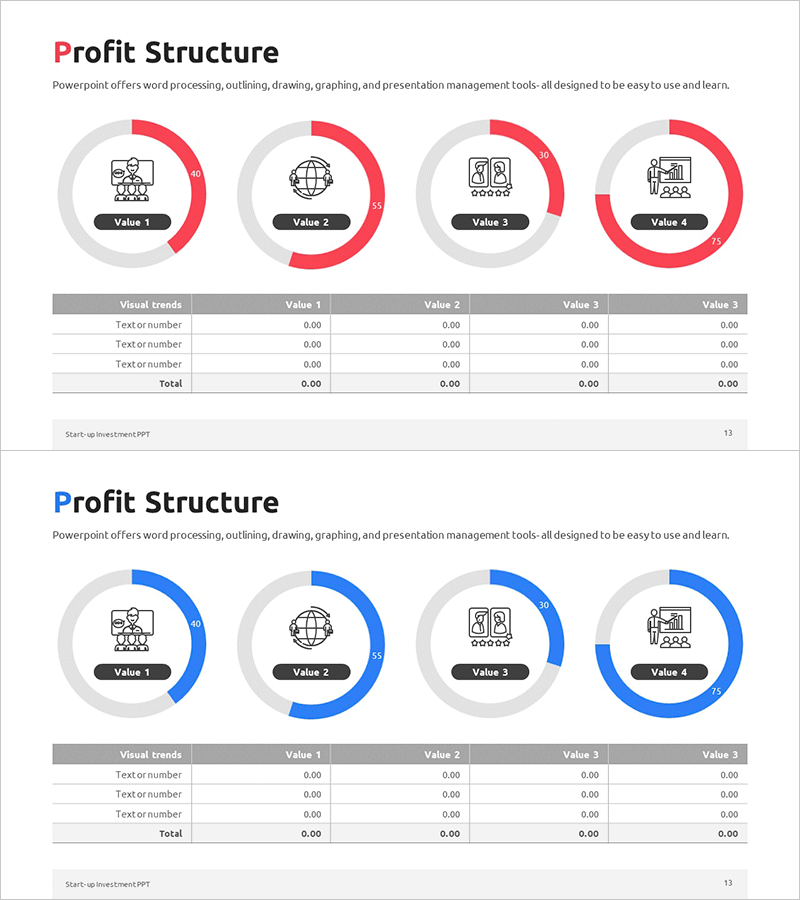
This slide uses a graph to intuitively visualize the changes in daily life after exercising. With a clean and clear data comparison structure, it is ideal for presentation materials related to exercise effects or lifestyle changes. The combination of a striking red accent and a gray background provides both attention and trustworthiness. This slide effectively communicates the theme of 'Daily Life Change', making it easy to insert and edit relevant data or statistics. The text and graph areas can be easily replaced, with an editing difficulty rated as 'easy', allowing for quick integration into various presentations.
Related Products
-
Bio Innovation Solutions – Effective Design for Operational Planning
#Operation Plan #Diagram #Graph
-
Ice Hockey Performance Graph – Competitiveness and Advantage
#Market and Competitor Analysis #Graph #Competitor Analysis
-
Target Market Share Analysis - Data Visualization with Graphs
#Market and Competitor Analysis #Graph #Other
-
Development Status Donut Chart – Business Introduction
#Product/Service #Business Introduction #Diagram
