Product/Service
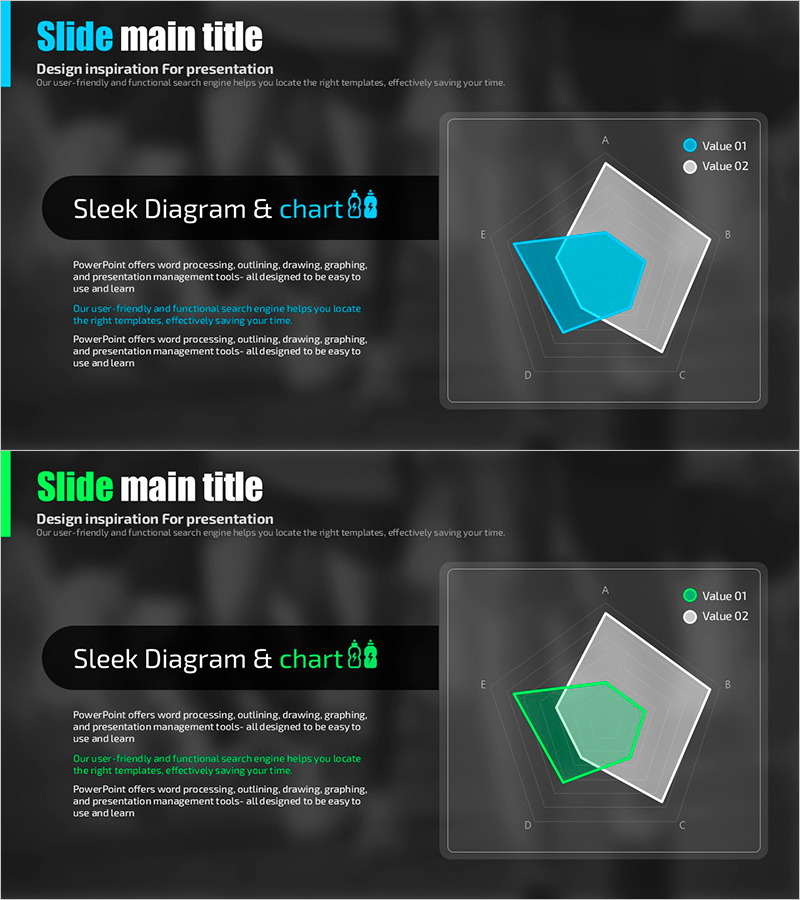
Radar Chart for Supplements Presentation
RJ0800024_21
- Last Update 12/21/2025
- File Size 1MB
- # of Slides 2
- File Format PPTX
- Slide Ratio 16:9
- Color
Keywords
About the Product
This slide utilizes a radar chart designed for effectively comparing and analyzing supplements. Its sleek diagram structure allows easy comparison of values at a glance, making it suitable for product presentations and marketing. The blue and green colors convey sophistication and trust, aiding audience understanding through intuitive graphic displays. This slide features an intuitive layout that allows easy replacement of various texts or data, with an overall editing difficulty rated as 'easy'.
Related Products
-
Dot Patterns Wide PowerPoint Template Image&Text – Marketing Strategy Introduction
#Product/Service #Marketing Plan and Strategy #Development Status
-
Donut Chart of Causes of Environmental Pollution – Visualization of Data Analysis
#Market and Competitor Analysis #Graph #Market Analysis
-
Sensuous Cloud Presentation Template for Financial Performance Visualization – Business Insight
#Financial Plans and Performance #Graph #Income Statement
-
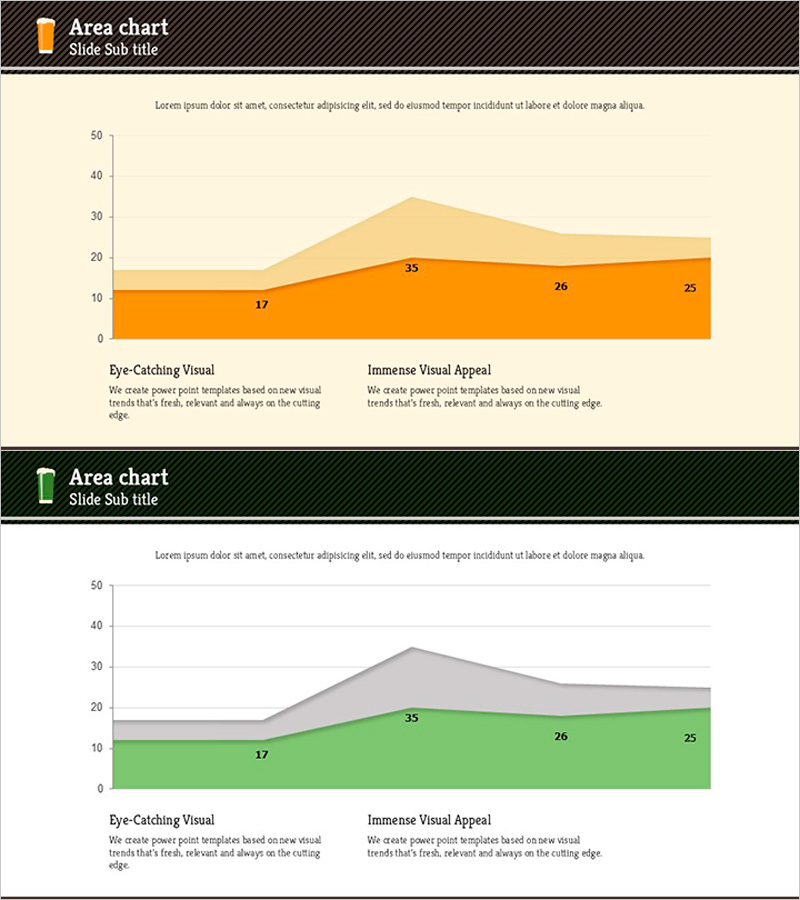
Shadow Area Graph for Data Visualization – Sensational Representation
#Graph
