Market and Competitor Analysis
Transport Bar Graph for Visualizing Market Trends – Competitive Advantage Analysis
RJ0800023_20
- Last Update 12/21/2025
- File Size 2.2MB
- # of Slides 2
- File Format PPTX
- Slide Ratio 16:9
- Color
Keywords
About the Product
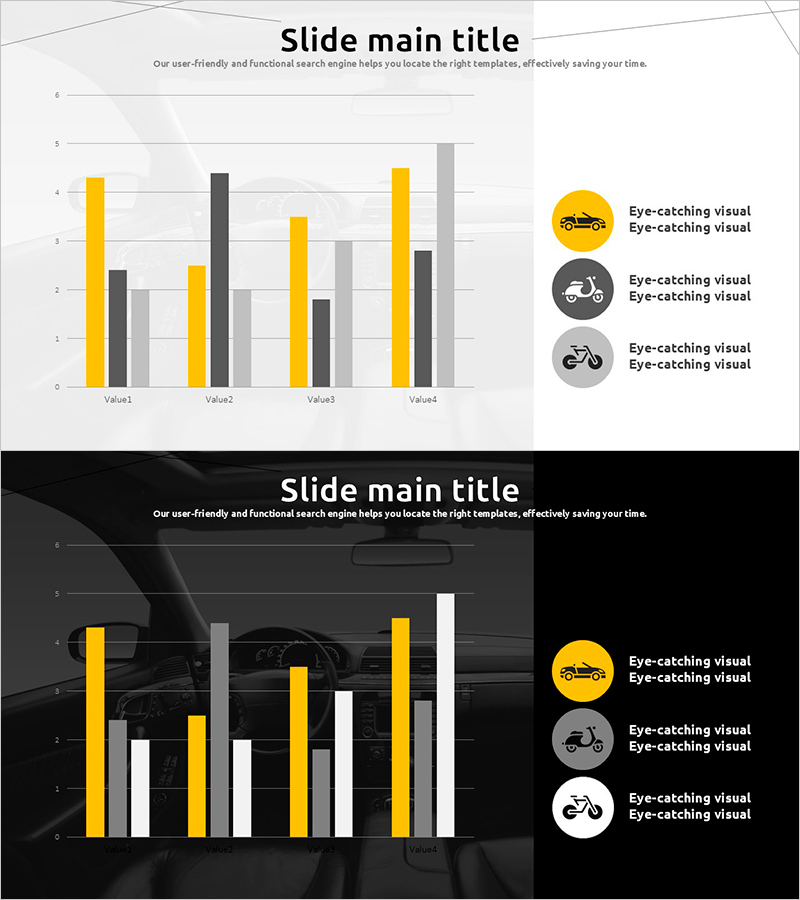
This slide effectively visualizes transport data through bar graphs, emphasizing market trends. The use of yellow and gray ensures clear data representation, while the simple layout facilitates intuitive understanding. It serves as an excellent presentation tool for market and competitor analysis related to transportation. The text and data are easily replaceable, with an editing difficulty rated as 'easy'.
Related Products
-
Gender Analysis Chart – Ideal for Market & Customer Analysis
#Market and Competitor Analysis #Financial Plans and Performance #Graph
-
Newspaper Wide PowerPoint Template Bar Chart – Effective Market Analysis Tool
#Market and Competitor Analysis #Marketing Plan and Strategy #Graph
-

Orange Hexagon Template – Segmented Horizontal Bar Graph
#Business Promotion Strategy #Market and Competitor Analysis #Graph
-
Gender Ratio Analysis Graph Chart – Data Visualization and Customer Insights
#Market and Competitor Analysis #Graph #Other
