
Market and Competitor Analysis
Muscle Mass Change Graph – Market Analysis Presentation
RJ0800015_14
- Last Update 12/21/2025
- File Size 8.2MB
- # of Slides 2
- File Format PPTX
- Slide Ratio 16:9
- Color
Keywords
About the Product
This slide visually represents muscle mass changes using a graph. Structured in both horizontal and vertical bar formats, it allows for straightforward data comparison, effectively conveying competitive advantages to potential clients and investors. The use of turquoise, orange, and blue colors creates a dynamic appearance, ensuring clear communication of information. This slide is particularly useful for presentations related to the fitness and healthcare industries. It includes easily replaceable text and data fields, with an editing difficulty rated as 'easy', enabling quick application in practical settings.
Related Products
-
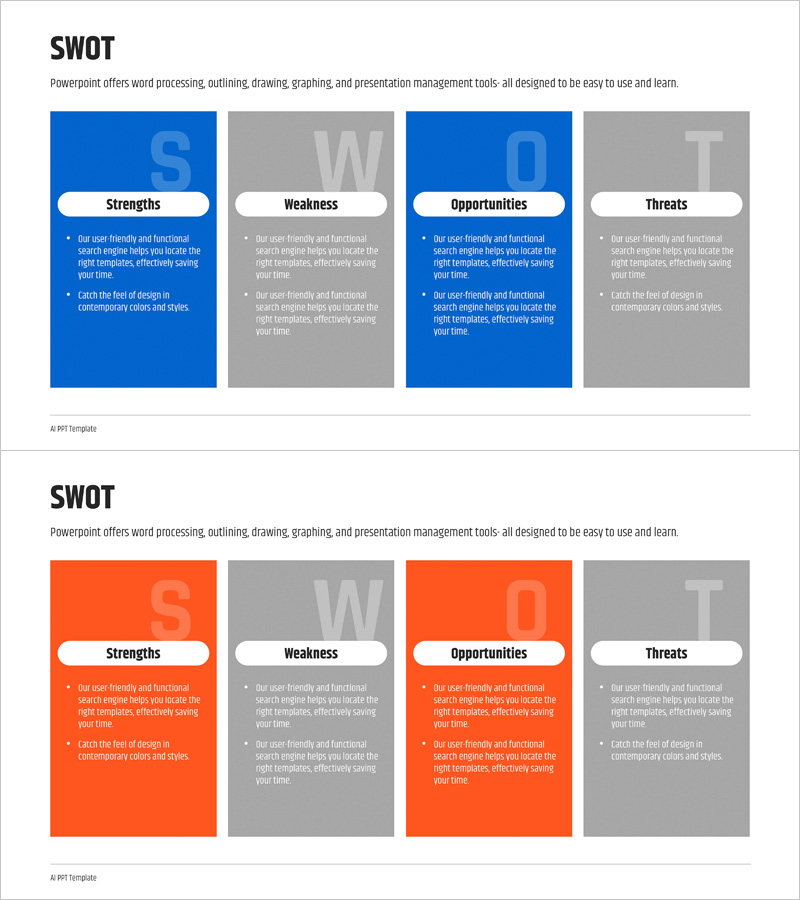
SWOT Analysis Square Diagram – Essence of Market Analysis
#Market and Competitor Analysis #Diagram #SWOT Analysis
-
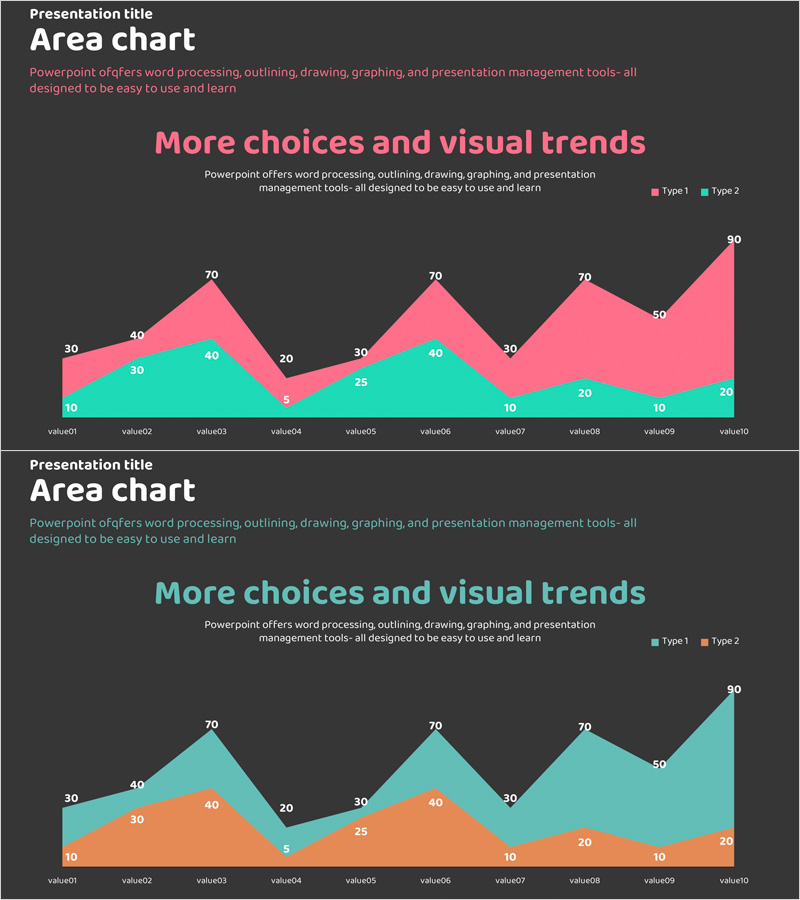
Graph Slide Visualizing Performance and Future Prospects in Pink and Bluegreen
#Company Introduction #Business Promotion Strategy #Graph
-
Designer’s Schedule Slide – A Visually Appealing Table
#Market and Competitor Analysis #Diagram #Market Analysis
-
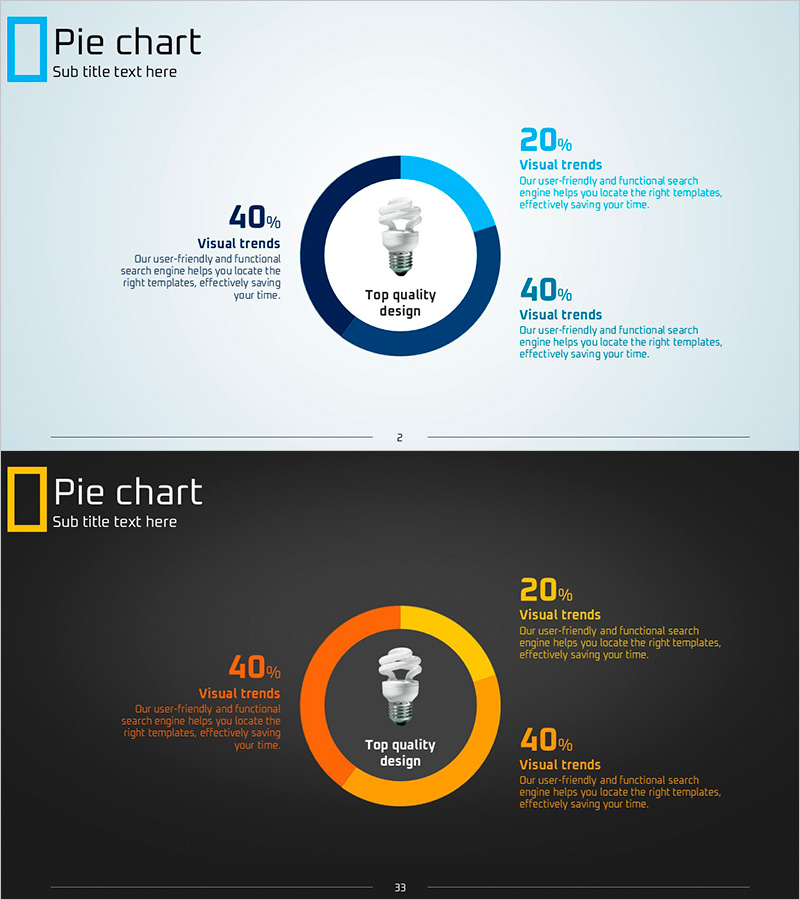
Eco-friendly Donut Chart Analysis – Market Status Delivery
#Market and Competitor Analysis #Graph #Market Status
