Business Promotion Strategy
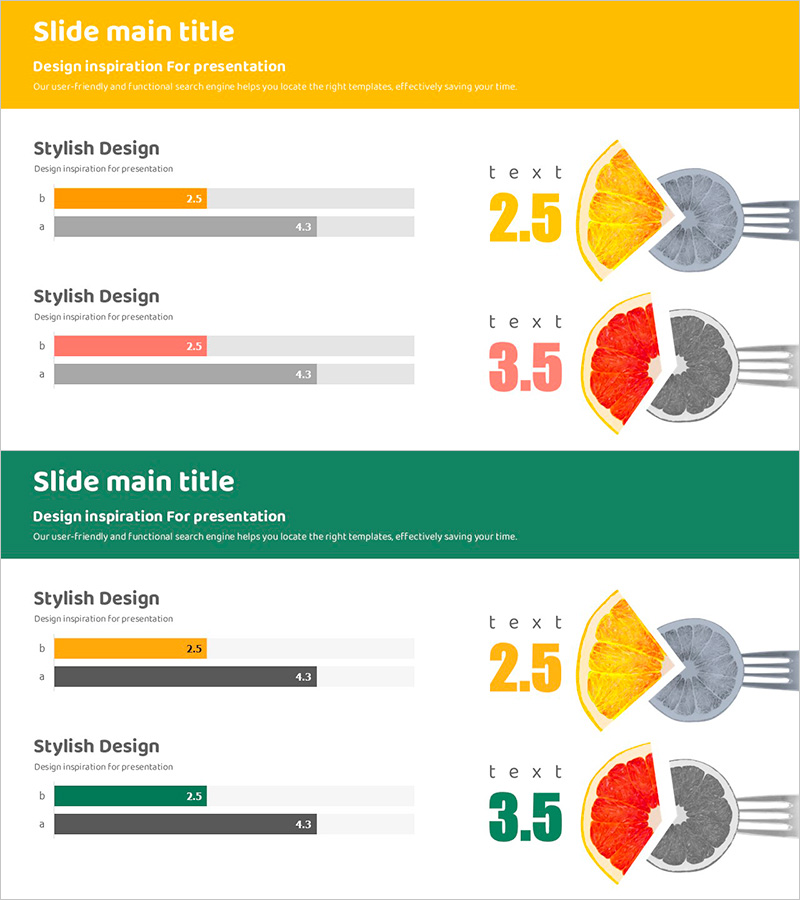
Orange and Grapefruit Consumption Ratio – Visualized Performance Analysis
RJ0800007_22
- Last Update 12/21/2025
- File Size 1.6MB
- # of Slides 2
- File Format PPTX
- Slide Ratio 16:9
- Color
Keywords
- #Content-Based Slides
- #Design-Based Slides
- #Business Promotion Strategy
- #Market and Competitor Analysis
- #Graph
- #Achievements
- #Market Analysis
- #Horizontal Bar
- #Segmented Horizontal Bar
- #16:9
- #consumption ratio
- #market analysis
- #orange consumption
- #grapefruit consumption
- #horizontal bar
- #segmented graph
- #performance
- #business strategy
About the Product
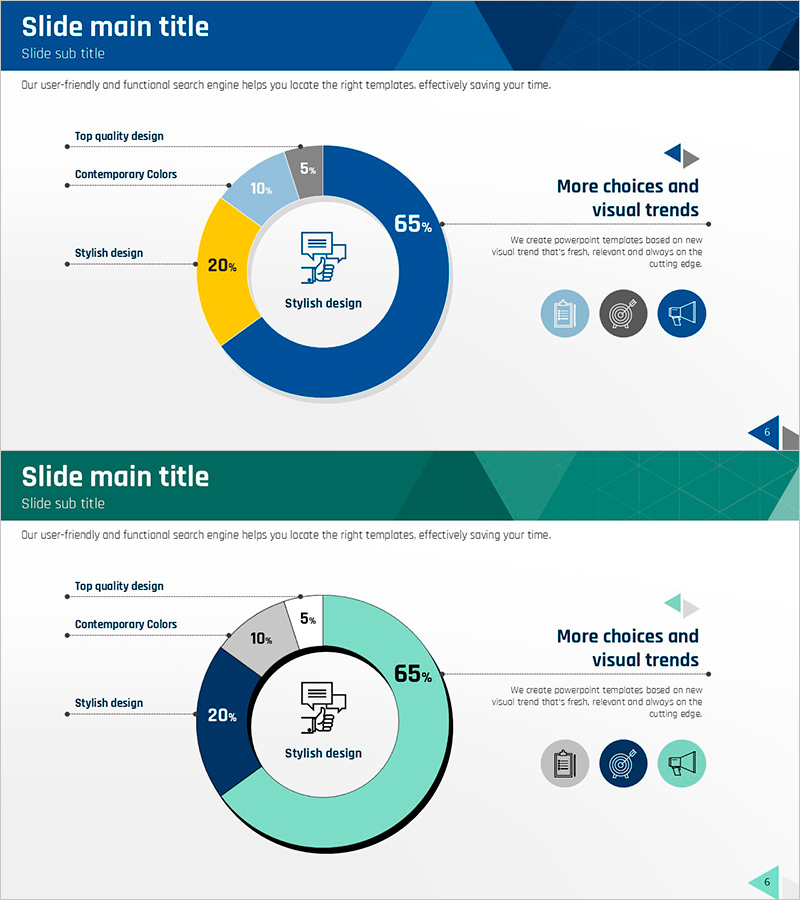
This slide features a horizontal bar chart template that visually presents the consumption ratio of orange and grapefruit. The clear color combination of orange and yellow allows for immediate understanding of the data. The segmented chart enables quick insights into customer consumption patterns, making it suitable for market analysis and strategic documentation. It is easy to edit, allowing for quick replacement with various data and text.
Related Products
-
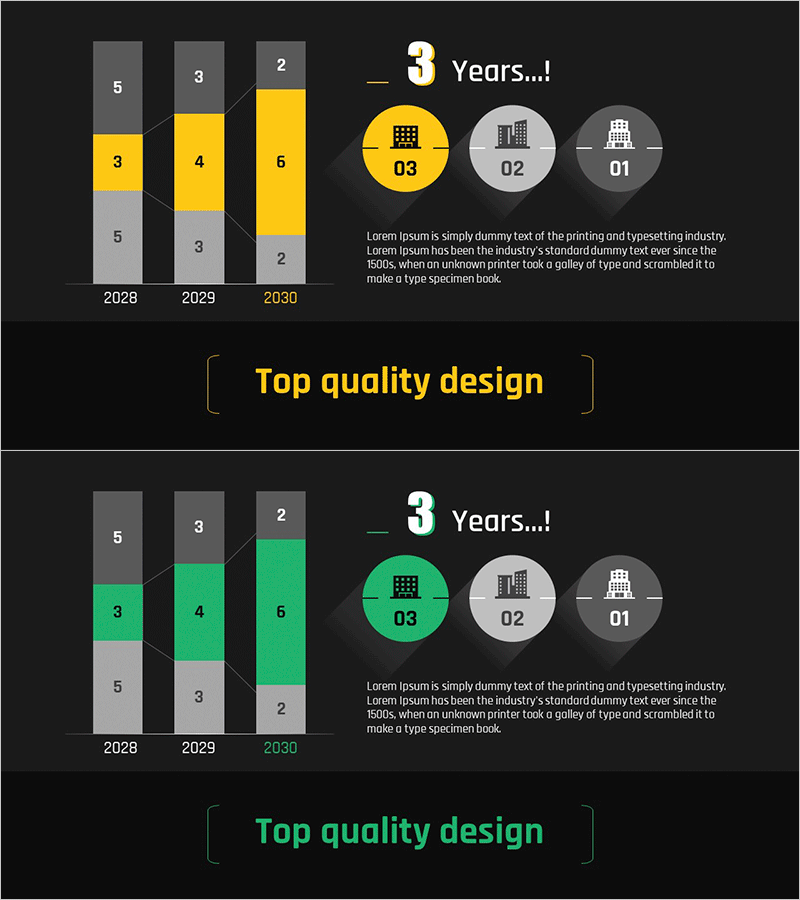
Segmentation Analysis Graph – Business Strategy and Future Outlook
#Business Vision and Strategy #Market and Competitor Analysis #Graph
-
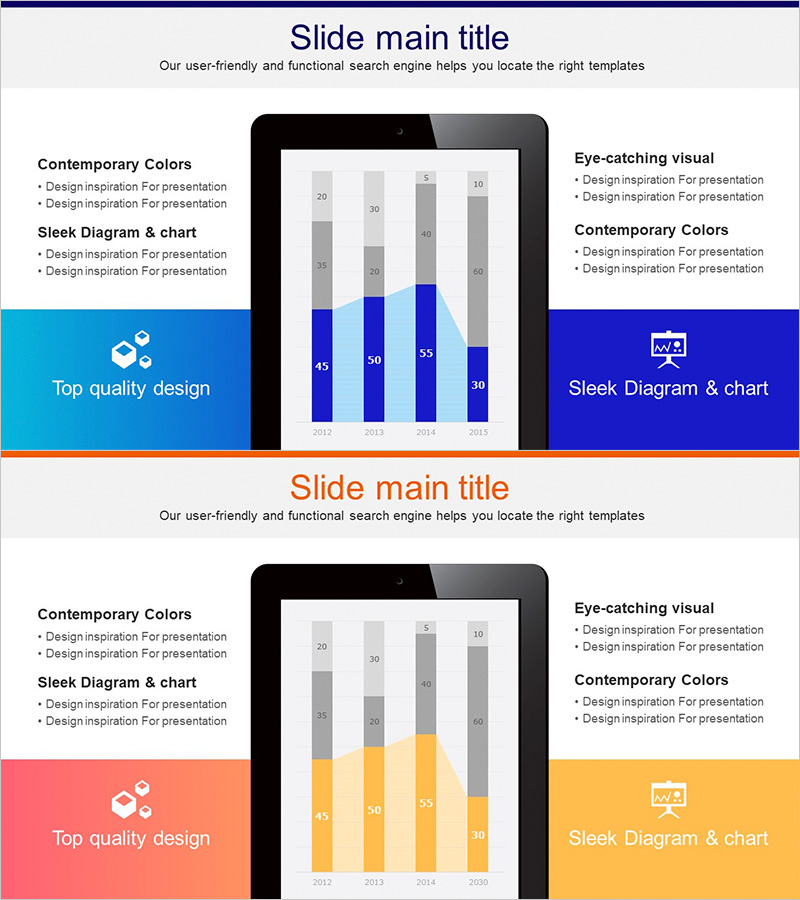
Tablet PC Mockup Vertical Bar Graph – Market Analysis and Tech Insights
#Business Introduction #Market and Competitor Analysis #Graph
-
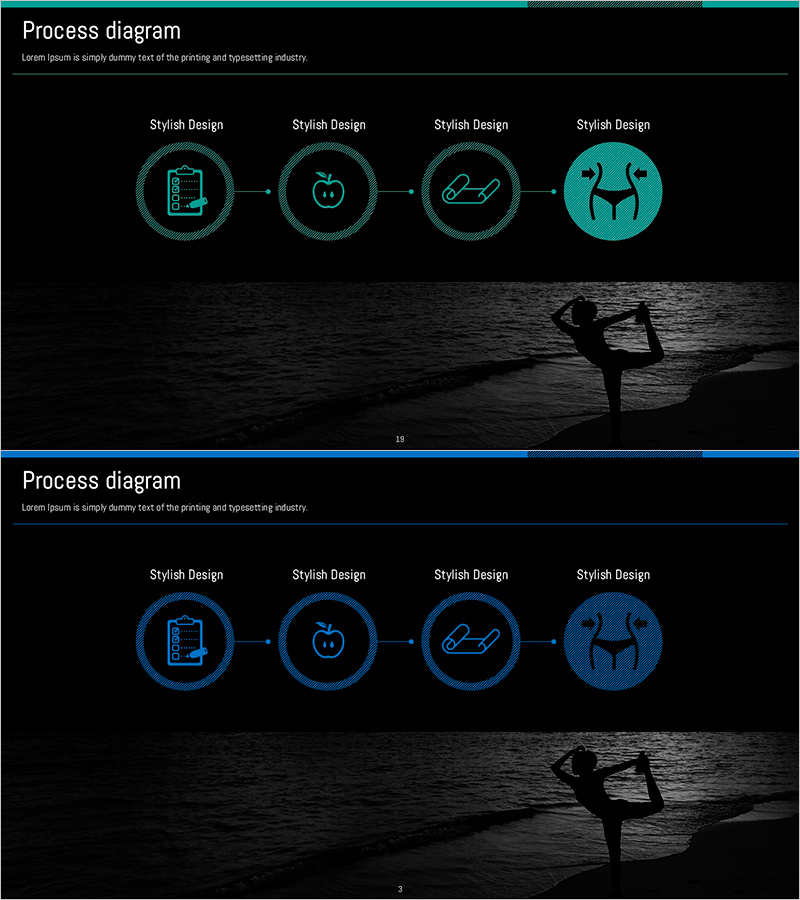
Visualizing Linear Process for a Successful Diet Program - Effective Strategies
#Business Vision and Strategy #Business Promotion Strategy #Diagram
-
Communication Marketing Donut Chart – Performance Visualization
#Company Introduction #Market and Competitor Analysis #Graph
