Emotional Messages
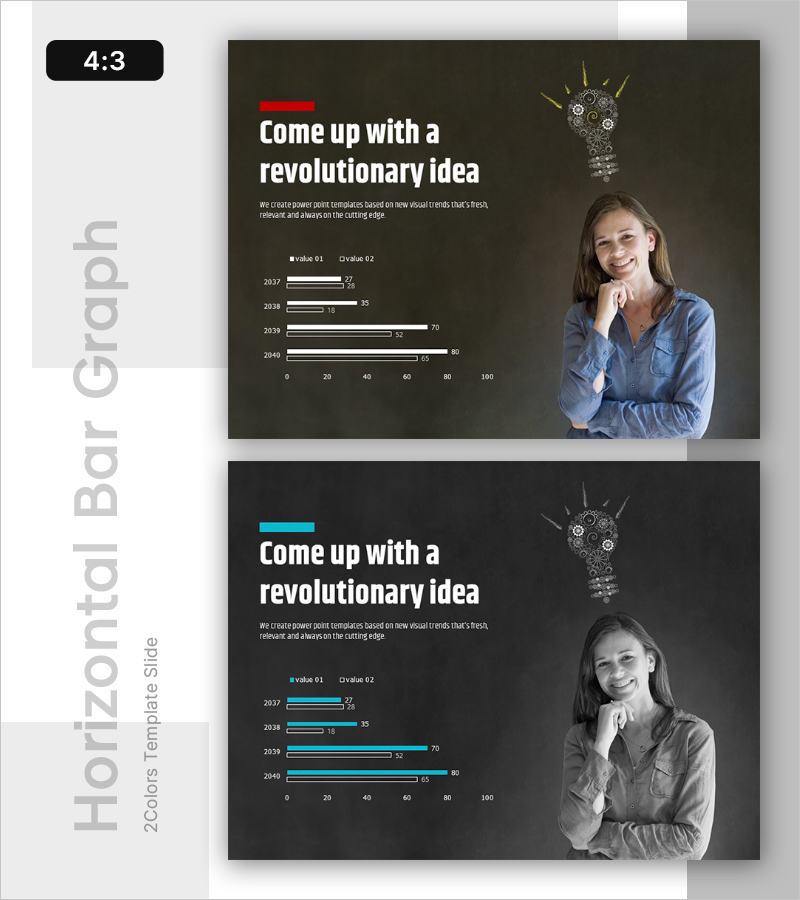
Come up with an Innovative Idea – Bar Graph for Market Analysis
RL0100067_4
- Last Update 12/21/2025
- File Size 1.8MB
- # of Slides 2
- File Format PPTX
- Slide Ratio 4:3
- Color
Keywords
About the Product
This slide utilizes a horizontal bar graph to visually present innovative ideas and market analysis content. It effectively compares two data values (value 01, value 02), providing a clear view of performance across different years. The visually appealing design, combined with a color scheme of black, white, red, and blue, makes it a perfect choice for impactful presentations. This is ideal for corporate strategy meetings, investor pitches, or team brainstorming sessions. The slide enhances audience comprehension through intuitive data representation and is easy to edit, aiding in efficient preparation.
Related Products
-
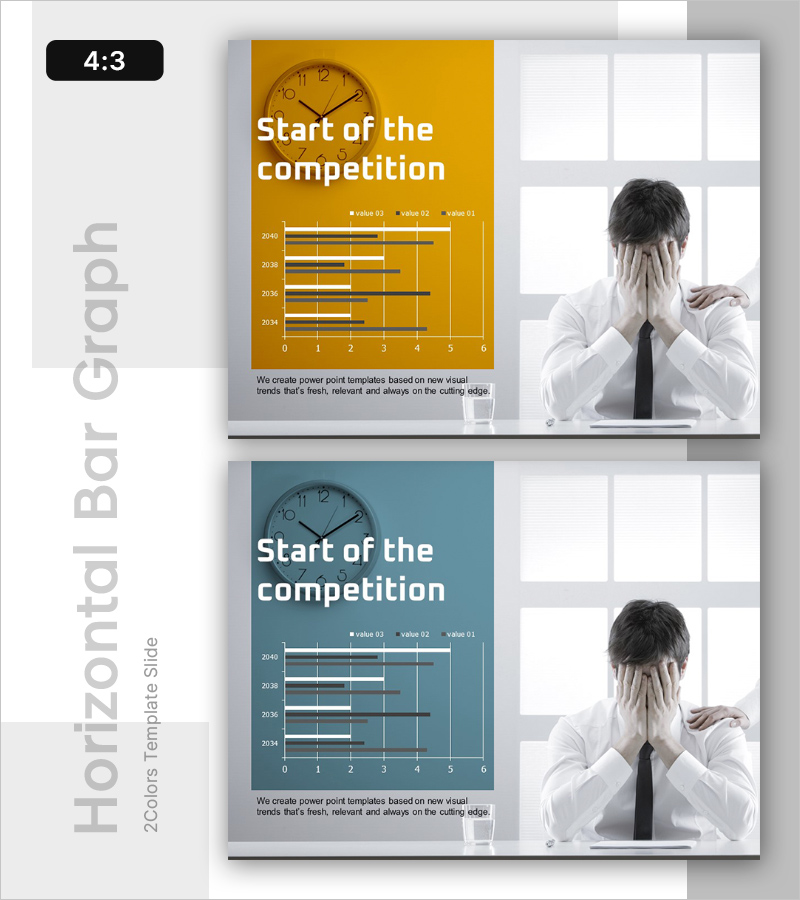
Competitor Comparison Analysis Graph – Summarizing Market Status
#Emotional Messages
-
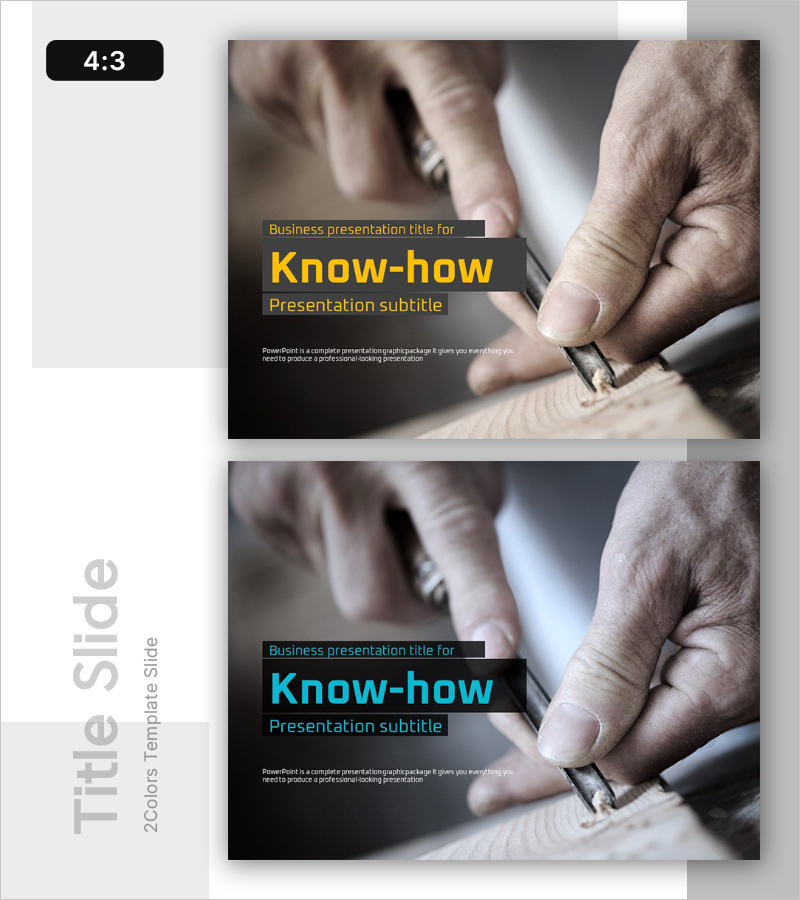
Knowhow Template Cover – Delivering Expertise and Trust
#Emotional Messages
-

Customer Insight Data Visualization
#Emotional Messages
-
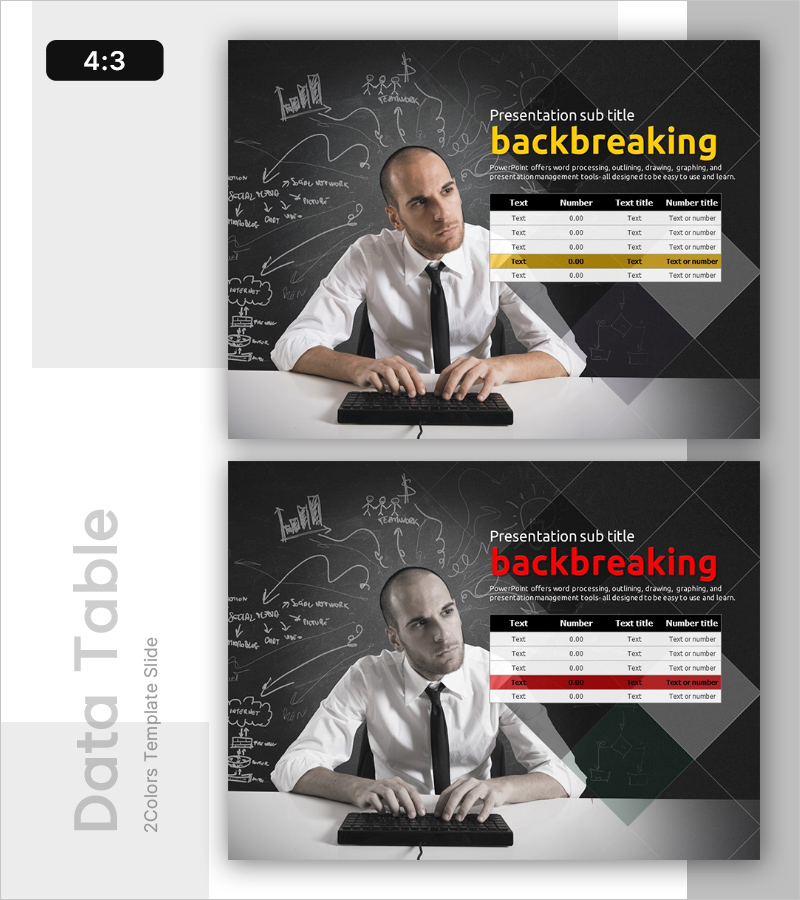
Table of Stress Status of Office Workers - Optimized Market Analysis
#Emotional Messages
