Table of Stress Status of Office Workers - Optimized Market Analysis
RL0100049_2
- Last Update 01/21/2025
- File Size 4.3MB
- # of Slides 2
- File Format PPTX
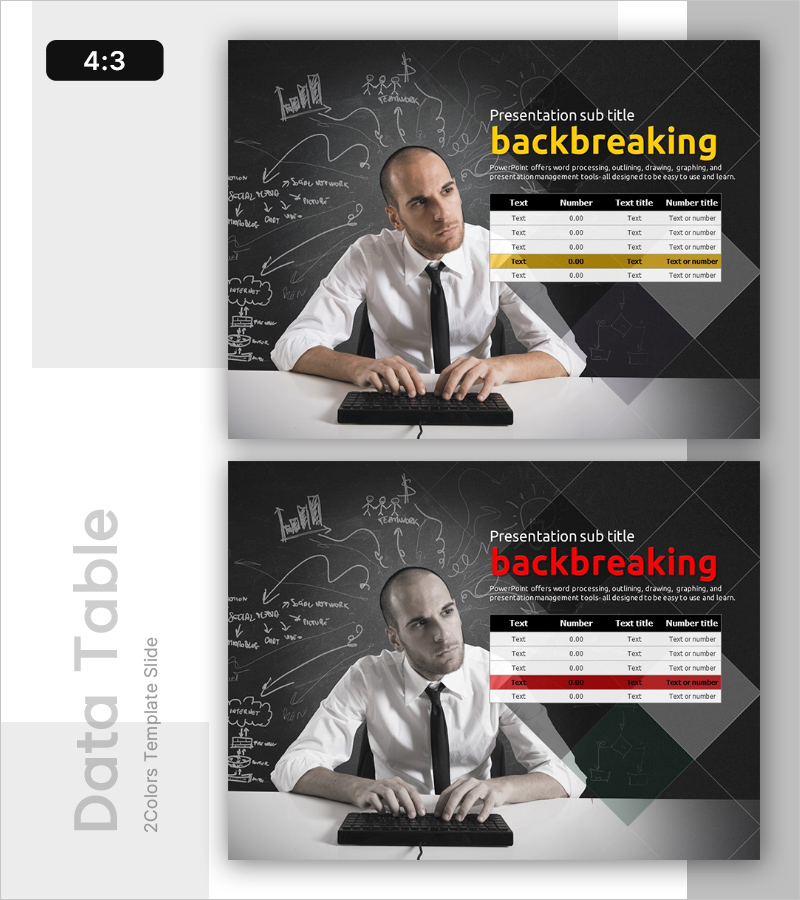
- Slide Ratio 4:3
- Color
Keywords
About the Product
A PowerPoint slide that analyzes and visualizes office worker stress levels through data-driven presentation. Built on a dark background with white typography and a yellow highlight row, this 5-row data table clearly displays stress indicators, numerical values, and categories in a structured format. The table features four columns—text, number, text title, and number title—enabling instant comparison of workplace stress metrics. This presentation slide is fully editable and ready for immediate use in company analysis reports, market research presentations, employee wellness initiatives, and organizational health discussions. Provided in 4:3 aspect ratio across 2 slides.
Usage Points
-
Main Usage
Present office worker stress indicators, current status, and numerical data through a structured table format, enabling objective analysis and organizational communication of workplace psychological well-being. Ideal for HR reports, employee wellness policy development, and organizational culture improvement initiatives.
-
How to Use
Edit table cells directly to input actual stress survey data. Use the yellow highlight row to emphasize key metrics, and leverage the high-contrast dark background layout for clear visibility in conference rooms and large presentation venues.
-
Recommended For
HR and organizational development teams presenting employee wellness initiatives, executive reports on organizational status, market research institutions analyzing workplace environments, and corporate culture improvement project kickoff meetings.
-
Slide Structure
2-slide set: Slide 1 features title, subtitle, descriptive text area, and a 5-row by 4-column data table (text, number, text title, number title columns). Slide 2 presents the same layout with color variation and repositioned yellow highlight row. All cells are independently editable with automatic table structure adjustment for data additions or deletions.


