Competitor Comparison Analysis Graph – Summarizing Market Status
RL0100010_3
- Last Update 01/19/2025
- File Size 2MB
- # of Slides 2
- File Format PPTX
- Slide Ratio 4:3
- Color
Keywords
About the Product
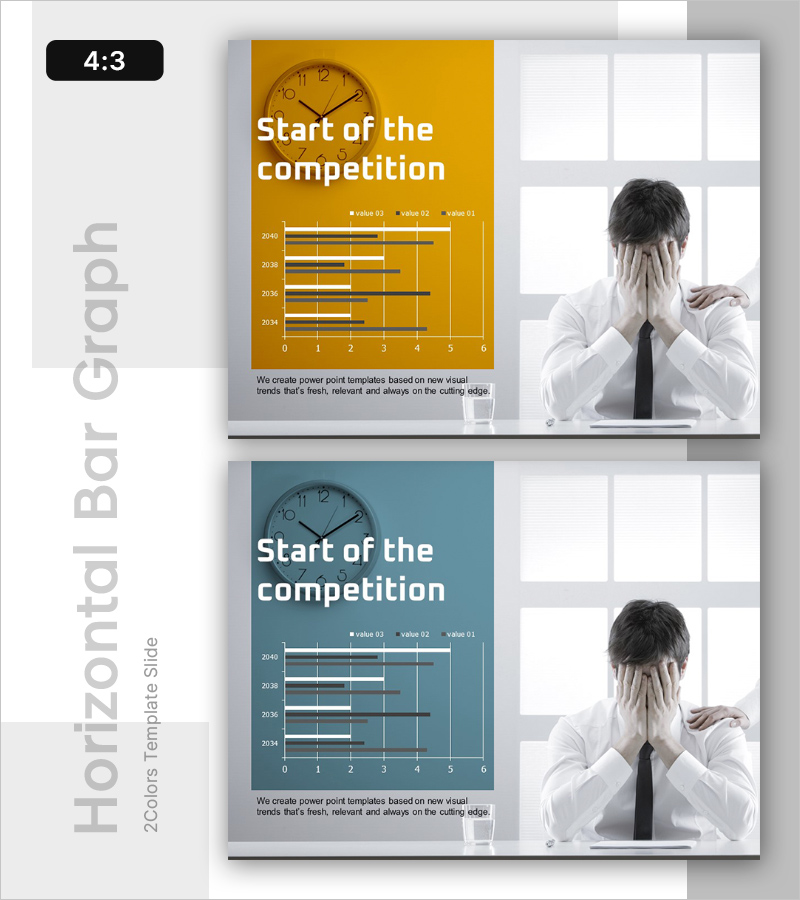
A horizontal bar chart PowerPoint slide designed to compare market status and competitor performance at a glance. Provided in two color versions—gold and blue—this slide visualizes data across multiple years and categories with three distinct data series. Each slide features a title section, central bar chart, and descriptive text area, making it ideal for investor presentations, executive briefings, and competitive positioning discussions. The 4:3 aspect ratio PPTX format is ready for immediate editing and customization.
Usage Points
-
Main Usage
Quantitatively compare competitor performance, market share, and capabilities to establish your company's objective market position. Ideal for investor relations, executive reporting, and strategic planning sessions where competitive advantage and improvement opportunities need clear visualization.
-
How to Use
Input year-by-year and category-specific data into the left-side bar chart area. Add analysis findings and insights in the right-side text box. Modify the color legend (value 01, 02, 03) to match your dataset, then complete the bottom description section with market summary statements.
-
Recommended For
Business development, marketing, and strategy professionals; investor relations managers; and executives presenting competitive analysis results. Particularly suited for new market entry, product positioning, and market share analysis presentations.
-
Slide Structure
Two-slide set: Slide 1 features a gold background with horizontal bar chart (4 years × 3 data series); Slide 2 presents the same chart structure on a blue background. Each slide organizes information into three hierarchical zones: title (top), bar chart (center), and explanatory text (bottom).
Related Products
-

Success Strategies for Overcoming Failure – Innovative Approach
#Emotional Messages
-

Business Competition Template Cover – The Start of Victory
#Emotional Messages
-

Failure Factor Analysis Procedure Diagram
#Emotional Messages
-

Comparative Analysis of Our Own Competitiveness – Effective Market Analysis Slide
#Emotional Messages
