
Market and Competitor Analysis
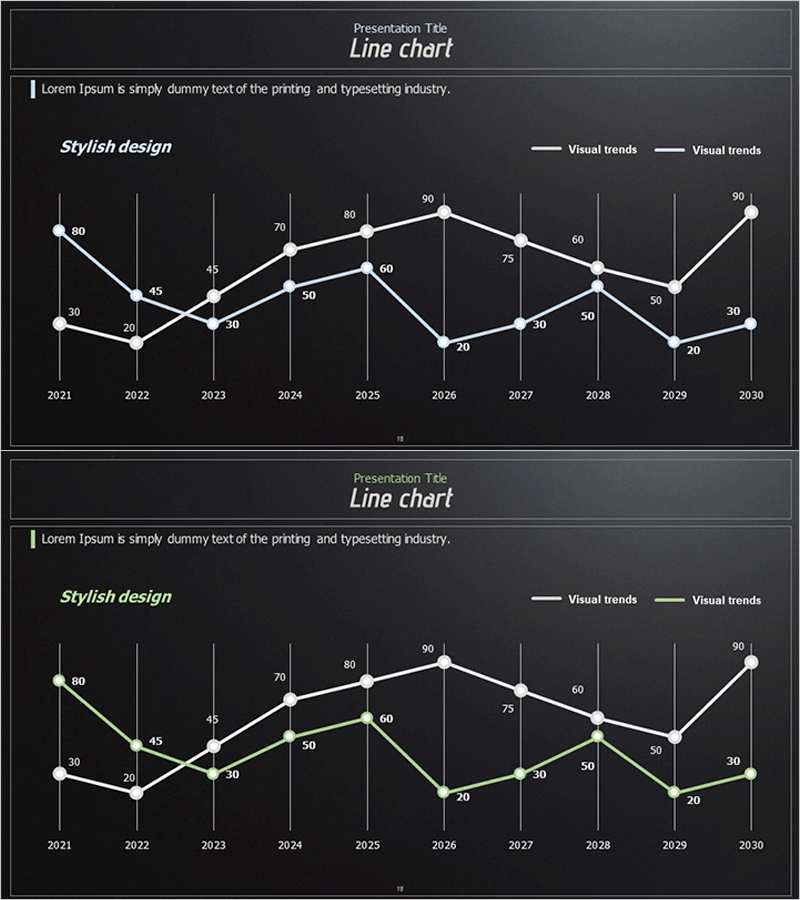
Comparison Graph of Future Outlook - Essential Tool for Market Analysis
RJ0700028_16
- Last Update 12/21/2025
- File Size 0.6MB
- # of Slides 2
- File Format PPTX
- Slide Ratio 16:9
- Color
Keywords
About the Product
This slide features a comparison graph designed to visually represent future outlooks utilizing both horizontal and vertical bar charts. With a harmonious color scheme of teal and red, it is crafted to clearly compare data, optimized for market analysis and competitor comparison. The data is well-organized with a prominent title area and a clear graph area, making it easily understandable for the audience. This graph serves as a powerful tool in management meetings, investment proposals, or business presentations where visual persuasion is essential.
Related Products
-
Blue Green Broken Line Graph – Optimized for Competitor Analysis Design
#Market and Competitor Analysis #Graph #Competitor Analysis
-
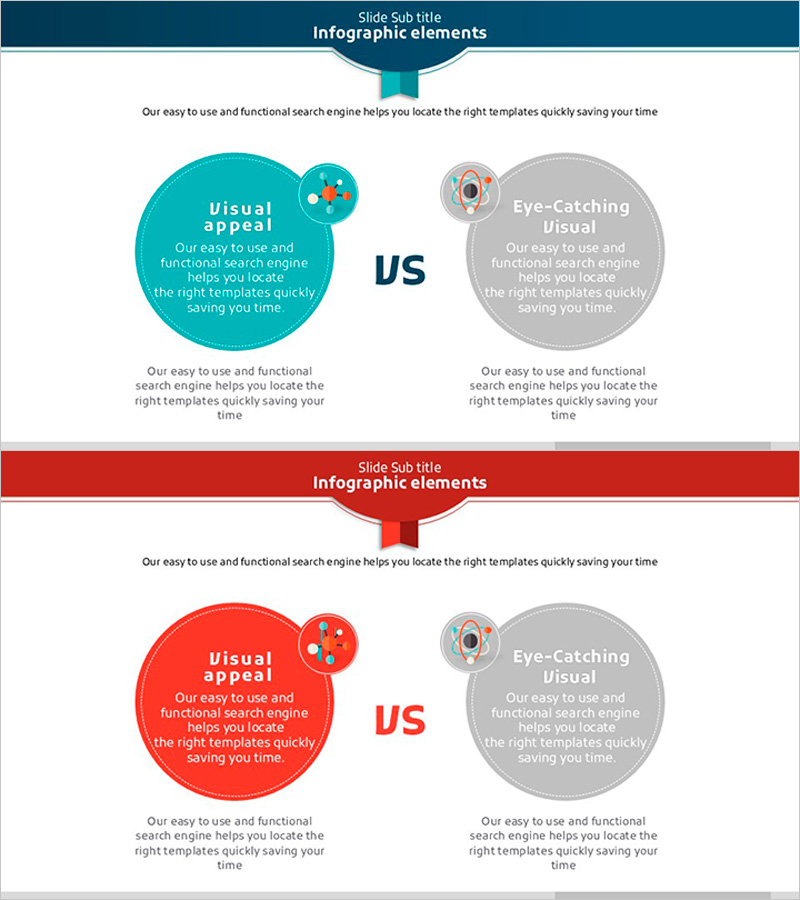
Science Component Comparison Slide – Effective Data Delivery Through Visual Comparison
#Operation Plan #Market and Competitor Analysis #Text Box
-
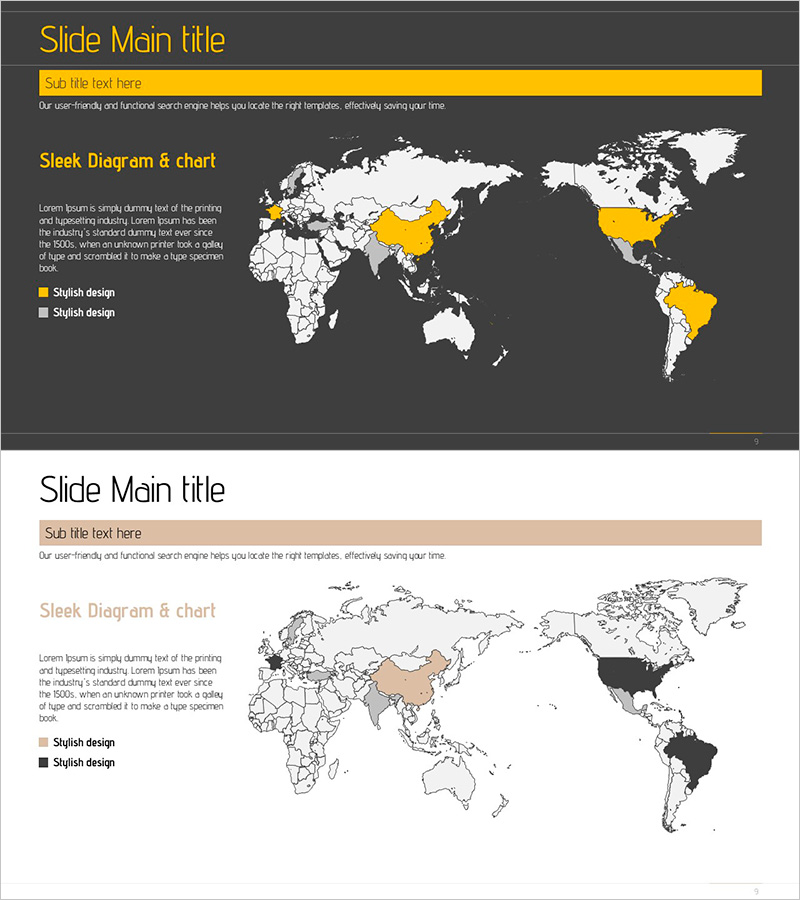
Emphasis on Target Market – Slide for Market Analysis
#Market and Competitor Analysis #Other #Target Market
-
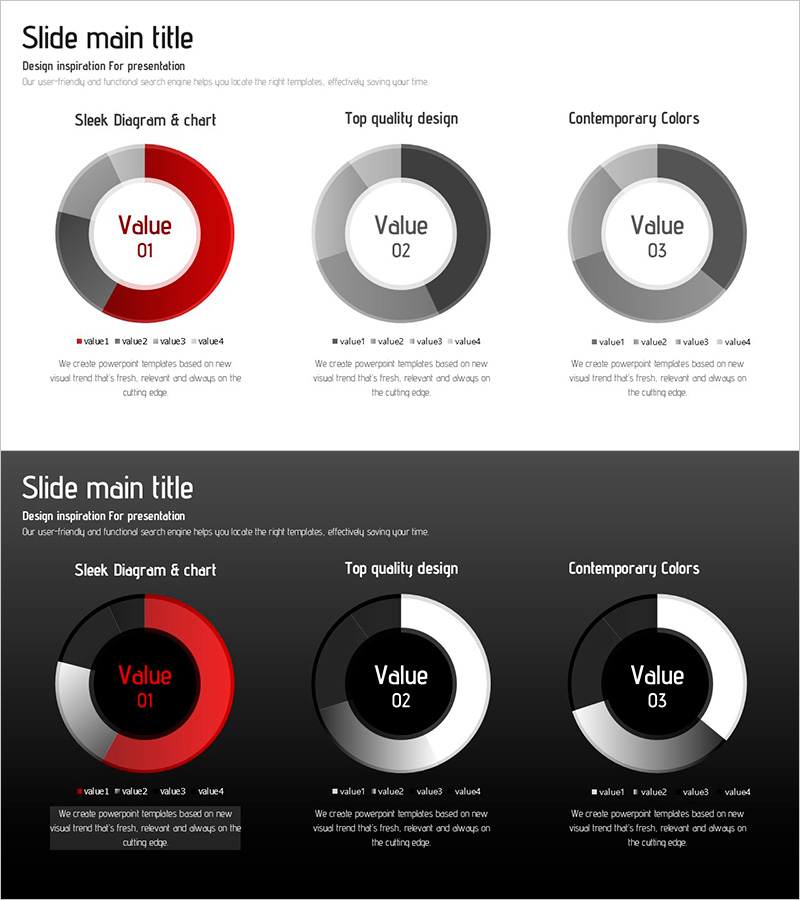
Origami Vision Donut Chart 2 – Market Analysis and Performance
#Market and Competitor Analysis #Financial Plans and Performance #Graph
