Business Vision and Strategy
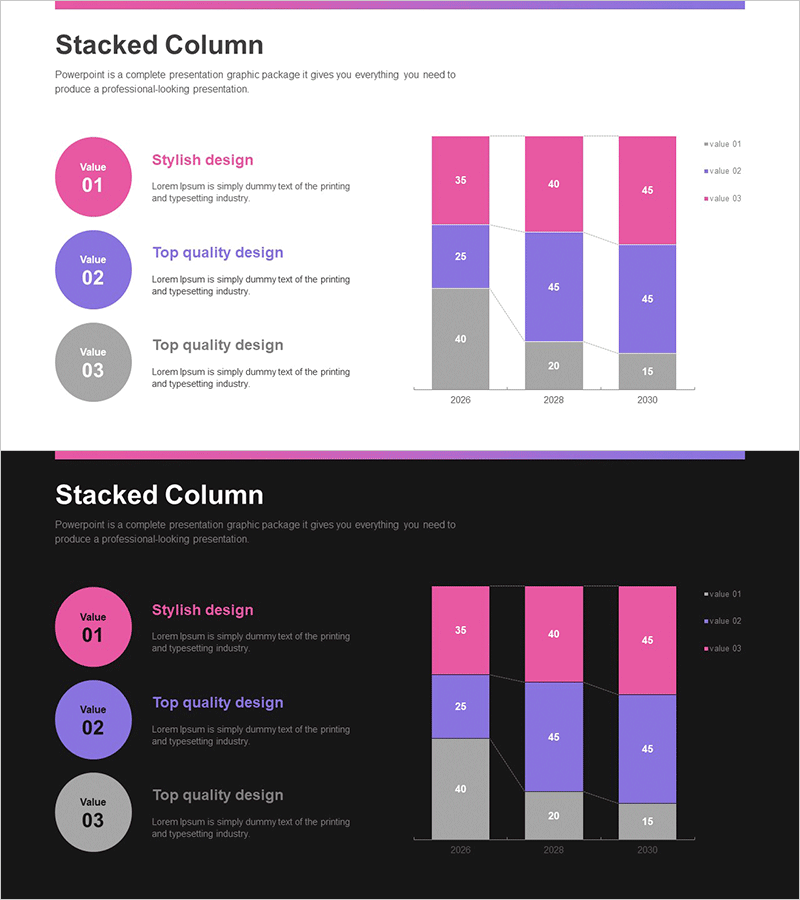
Business Objectives & Segmentation Graph – Visualizing Business Vision
RJ0700027_10
- Last Update 12/21/2025
- File Size 0.3MB
- # of Slides 2
- File Format PPTX
- Slide Ratio 16:9
- Color
Keywords
About the Product
This PowerPoint slide effectively visualizes business objectives and market segmentation using a vertical bar graph. Constructed with a modern and stylish design, the purple, white, and black color combination enhances sophistication. This slide provides practical data on market trends and objectives by year, making it an excellent visual resource for strategy formulation and presentations. It is a superb choice for internal reports, investment proposals, or strategic presentations.
Related Products
-

Medical Industry Competitor Analysis Vertical Bar Graph
#Market and Competitor Analysis #Graph #Competitor Analysis
-
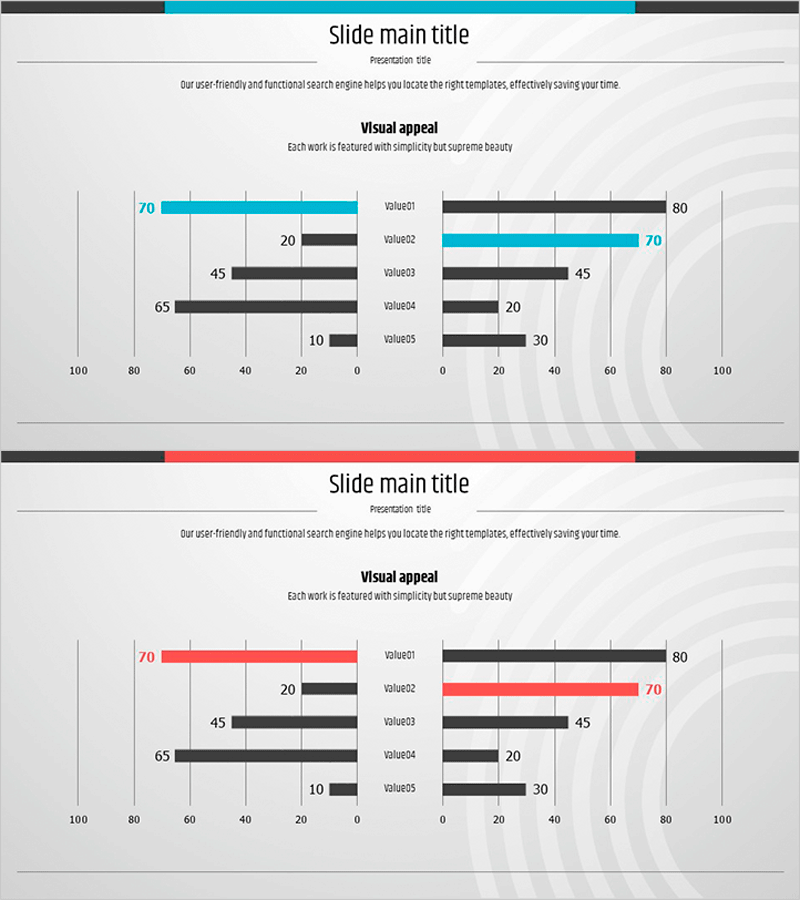
Identity Wide Template – Double Horizontal Bar Graph Usage
#Market and Competitor Analysis #Graph #Competitive Advantage
-
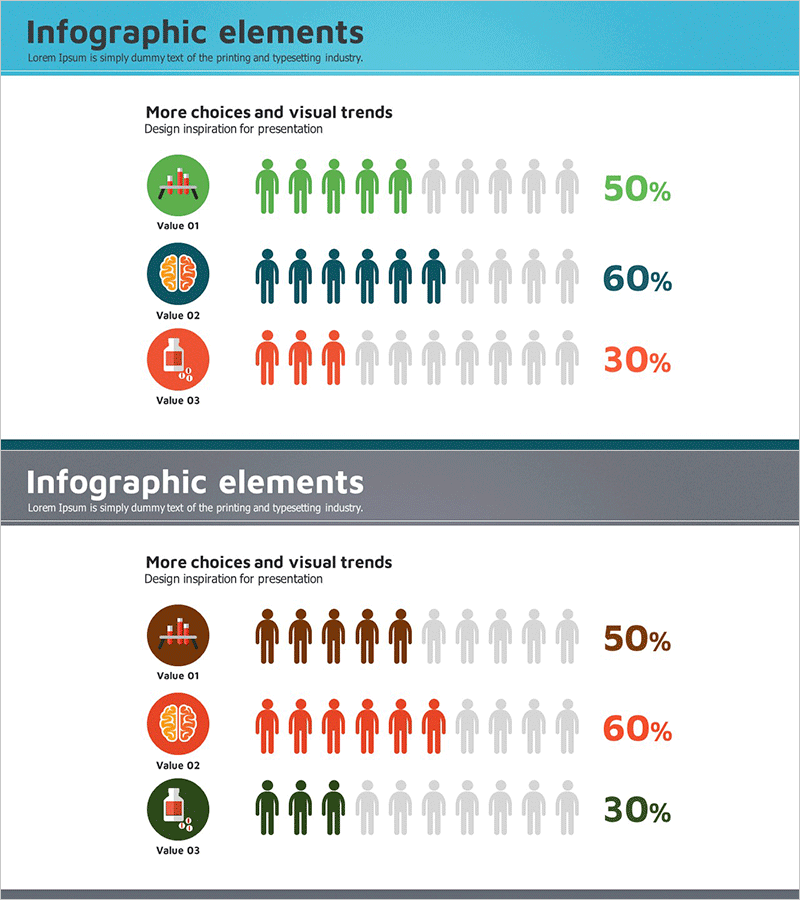
Medical Illustration Customer Analysis Silhouette Graph – Visualizing Customer Psychology
#Market and Competitor Analysis #Graph #Other
-
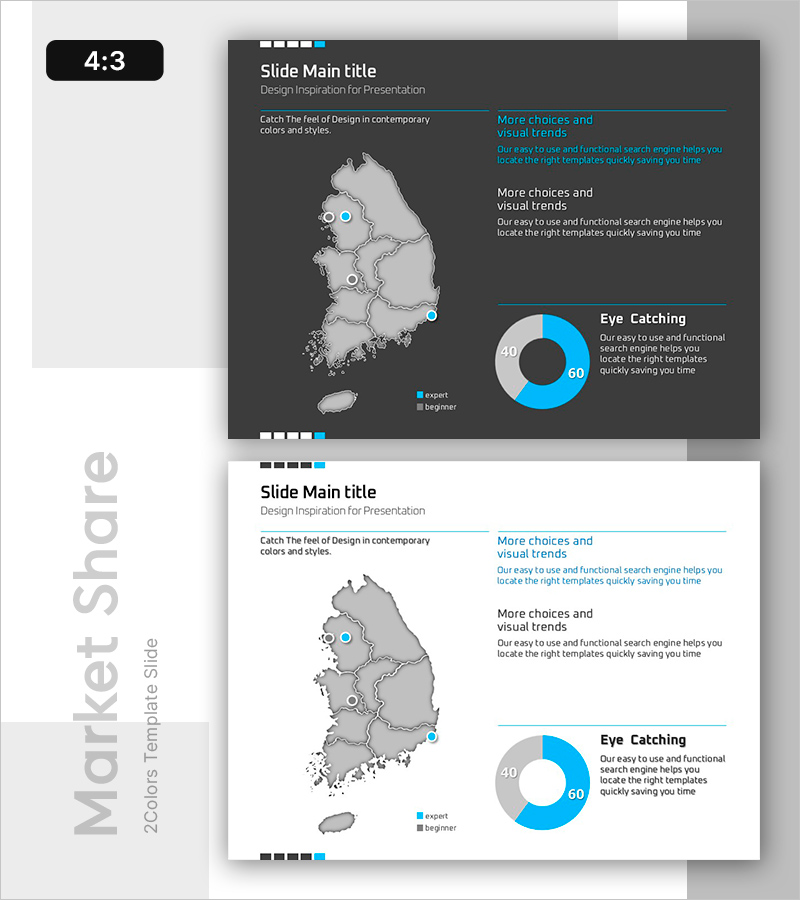
Visualizing South Korea's Market Share – Data-Driven Insights
#Company Introduction #Market and Competitor Analysis #Graph
