
Company Introduction
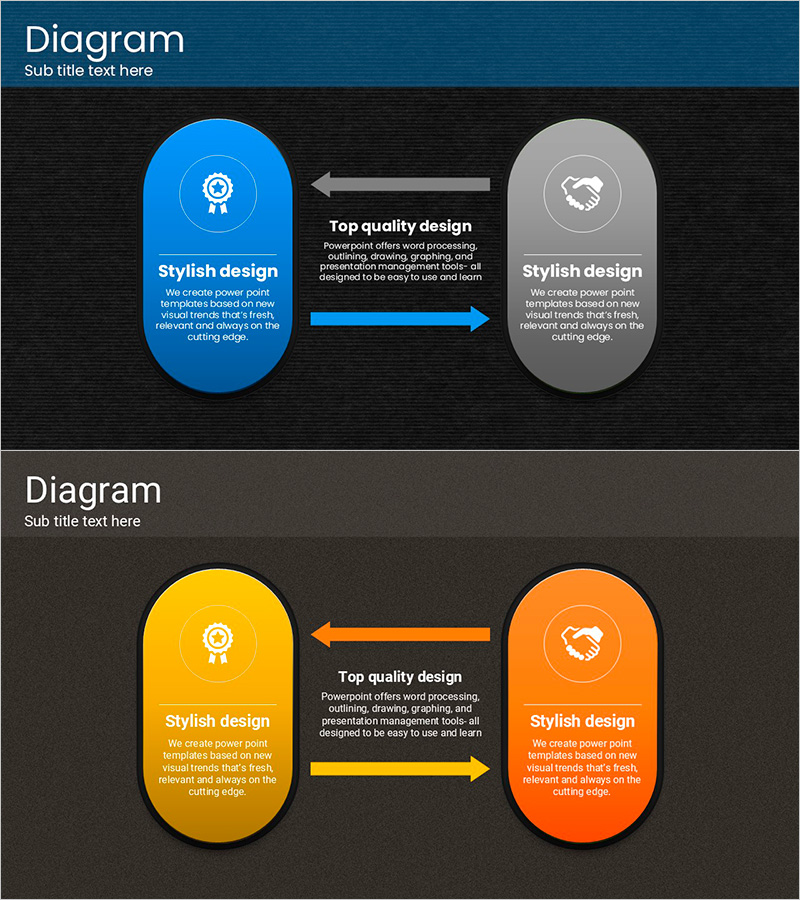
Manpower Gradient Diagram – Visualizing Team Capacity
RJ0700015_4
- Last Update 12/21/2025
- File Size 1.7MB
- # of Slides 2
- File Format PPTX
- Slide Ratio 16:9
- Color
Keywords
About the Product
This slide utilizes a manpower gradient diagram to clearly visualize the capabilities and values of a team. The main colors are composed of blue and orange, designed for easy understanding. This design is effective for various presentation scenarios such as HR management, team introductions, and explaining organizational values. It is particularly suitable for executive reports or educational presentations that emphasize the importance of teamwork and collaboration. Text and image elements can be easily replaced for natural and fluid editing, with an overall editing difficulty rated as 'easy'.
Related Products
-
Touch Diagram for Business Strategy Visualization – Clear Flow Communication
#Product/Service #Business Vision and Strategy #Diagram
-
Donut Chart of Usage Ratio – Competitive Advantage Analysis
#Business Promotion Strategy #Market and Competitor Analysis #Diagram
-
Cluster Diagram for Future Business Outlook
#Technology Sector #Diagram #Future Development Direction
-
Trend Color Wide Template Map&Table – The Essence of Marketing Strategy Visualization
#Marketing Plan and Strategy #Financial Plans and Performance #Diagram
