Trend Color Wide Template Map&Table – The Essence of Marketing Strategy Visualization
RJ0200045_15
- Last Update 04/11/2025
- File Size 1.5MB
- # of Slides 2
- File Format PPTX
- Slide Ratio 16:9
- Color
Keywords
- #Content-Based Slides
- #Design-Based Slides
- #Marketing Plan and Strategy
- #Financial Plans and Performance
- #Diagram
- #Other
- #Target Setting
- #Projected Return on Investment (ROI)
- #Table
- #Standard Table
- #Map
- #16:9
- #world map PowerPoint slide
- #global marketing PPT template
- #regional data visualization
- #world map table slide
- #international business presentation
- #geographic data PowerPoint
About the Product
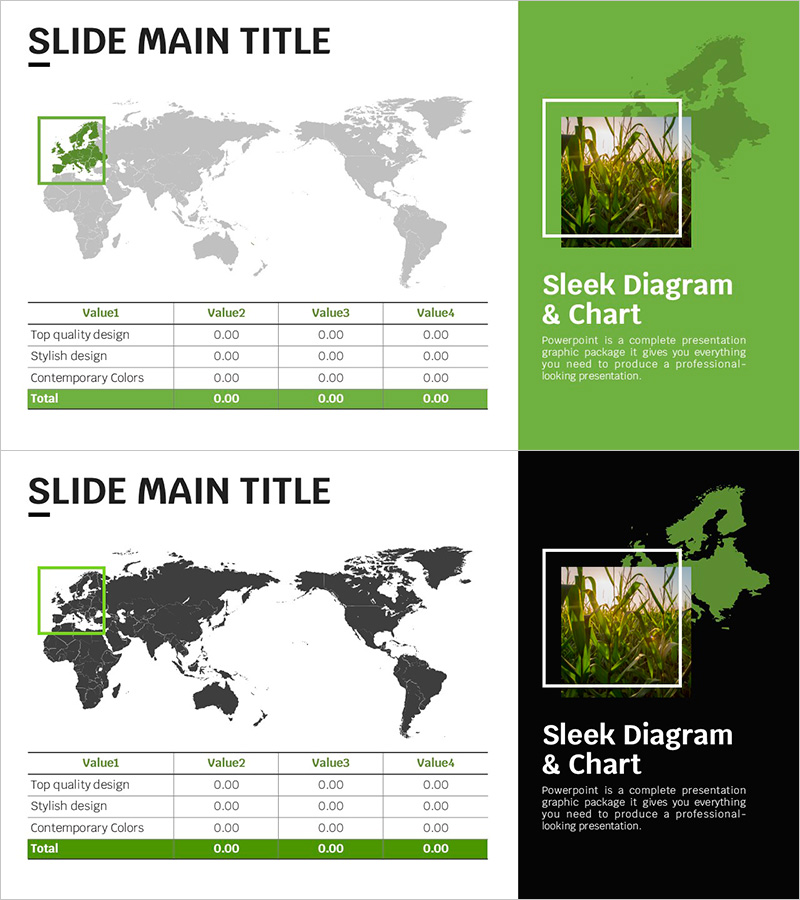
A 2-slide PowerPoint presentation combining a world map with a data table for global business visualization. Features a bright green background with Europe region highlighted and a 4-column data table positioned below the map, ideal for marketing strategy, regional performance analysis, and international business reporting. Delivered in 16:9 widescreen PPTX format, fully editable with customizable region highlights and data input fields. The map emphasizes selected geographic areas while the table displays corresponding metrics, making it perfect for presenting global expansion plans, regional sales performance, and international market analysis in business presentations.
Usage Points
-
Main Usage
Highlight specific geographic regions on the world map and input regional performance metrics in the data table below to visualize global marketing strategies, international business status, and regional sales results simultaneously. The combination of map highlights and structured data table enables clear communication of both spatial information and quantitative metrics in a single visual.
-
How to Use
On the first slide, highlight target regions (Europe, Asia, Americas, etc.) using the green accent color on the world map. On the second slide, populate the table with regional data such as sales figures, customer counts, or market share percentages. Maintain visual hierarchy using the green background and white table borders while presenting your business narrative across both slides.
-
Recommended For
Marketing managers, sales directors, business executives, and international business teams. Ideal for regional performance reviews, global expansion strategy presentations, international market status reports, and multinational company regional business updates.
-
Slide Structure
Slide 1: World map with Europe region highlighted in green box + title area. Slide 2: 4-column data table (Value1, Value2, Value3, Value4) × 3 data rows (Top quality design, Stylish design, Contemporary Colors) + Total row + title area. Full 16:9 widescreen format with consistent green accent color throughout.
Related Products
-

Global Market Outlook Analysis – Diagram Based Presentation
#Company Introduction #Market and Competitor Analysis #Diagram
-

Water Resources Presentation Template Map
#Company Introduction #Marketing Plan and Strategy #Other
-

Europe and New York Map Market Share Table
#Market and Competitor Analysis #Diagram #Other
-

Target Market Emphasis Message – Clarifying Strategy for Target Market
#Marketing Plan and Strategy #Other #Target Market Strategy
