Product/Service
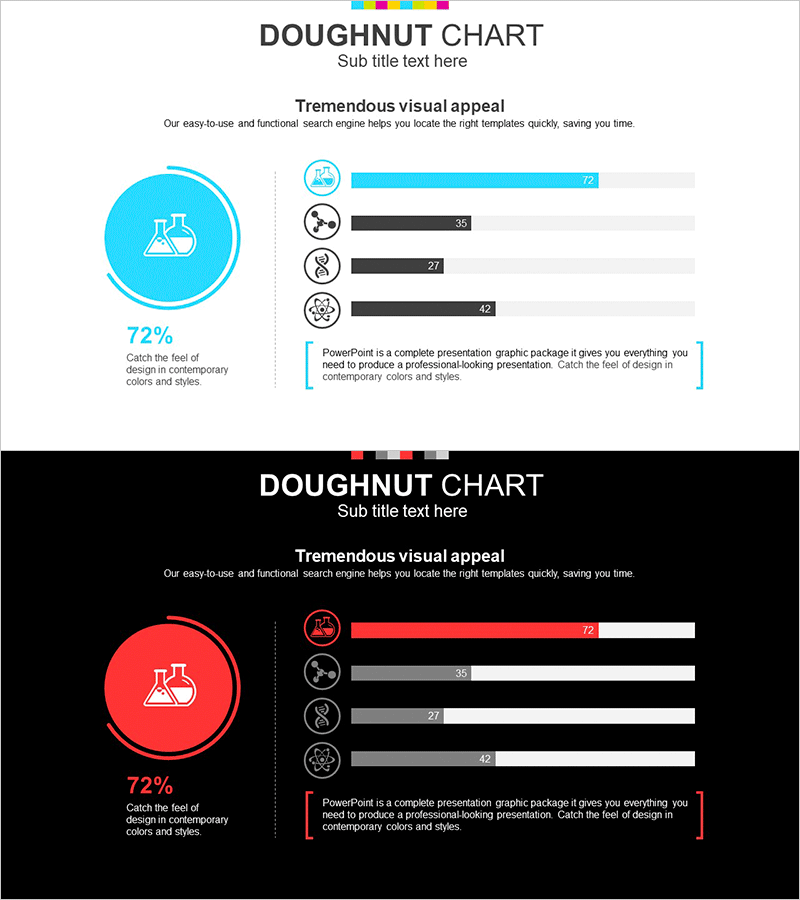
Chemistry Experiment Progress Graph – Visualizing Market Share
RJ0700008_11
- Last Update 12/21/2025
- File Size 1.2MB
- # of Slides 2
- File Format PPTX
- Slide Ratio 16:9
- Color
Keywords
About the Product
This slide features a doughnut chart and horizontal bar chart designed to intuitively show the progress of chemistry experiments. Its simple design with strong color contrast effectively conveys information, making it suitable for chemistry research results or market analysis presentations. The black and white color combination provides an elegant feel, effectively presenting accurate figures for each item. Especially infused with the theme of 'market share', it can be utilized in various business environments such as competitive analysis and research presentations. Text and data areas are easy to edit, with an editing difficulty rated as 'easy', enabling quick integration into various presentations.
Related Products
-
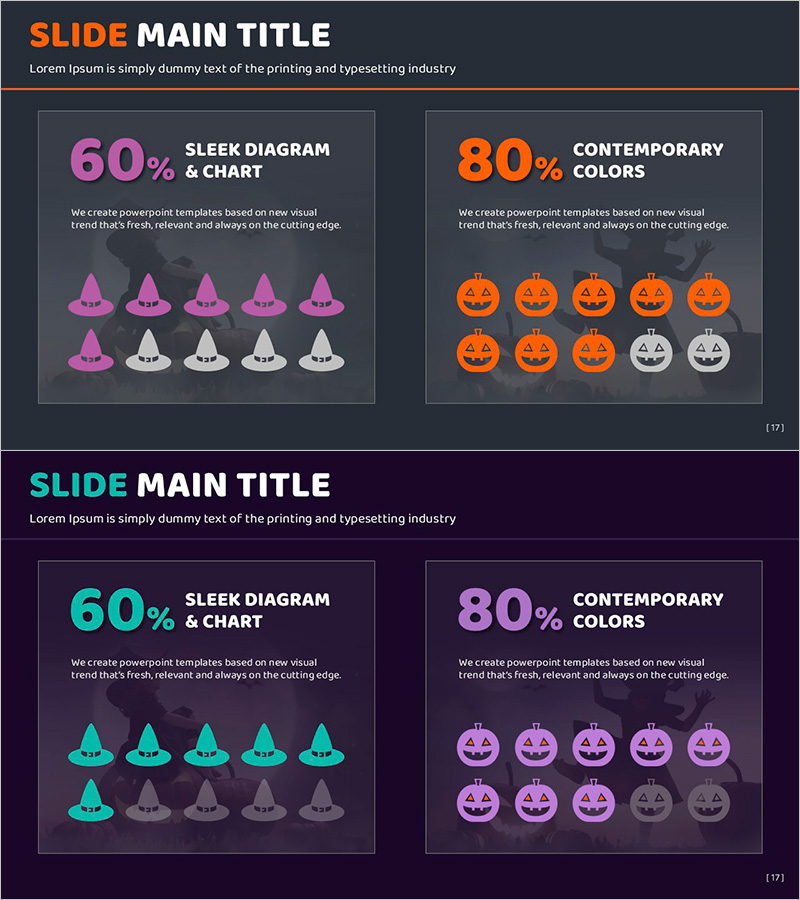
Halloween Hats and Pumpkin Charts – Ideal for Market Analysis
#Market and Competitor Analysis #Graph #Other
-
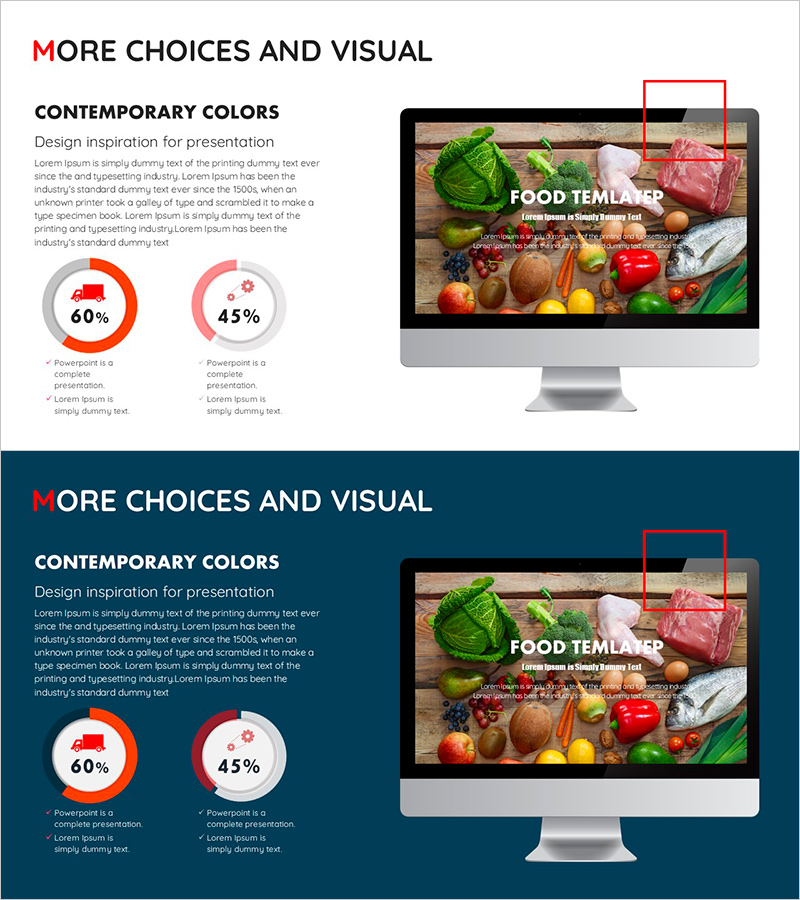
Distribution Graph of Food Materials – Market Status Chart
#Market and Competitor Analysis #Graph #Other
-
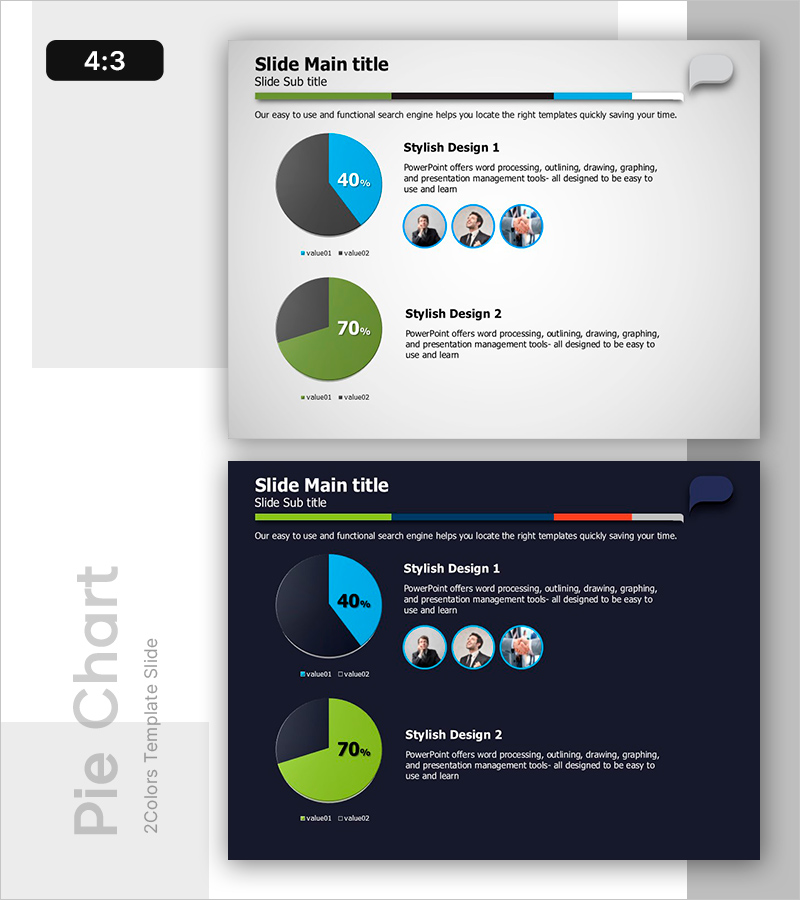
Two Pie Charts with Commentary – Market Share Analysis
#Market and Competitor Analysis #Graph #Market Status
-
Collaborative Business Process – Visualized by Cluster
#Product/Service #Diagram #Program Introduction
