Market and Competitor Analysis
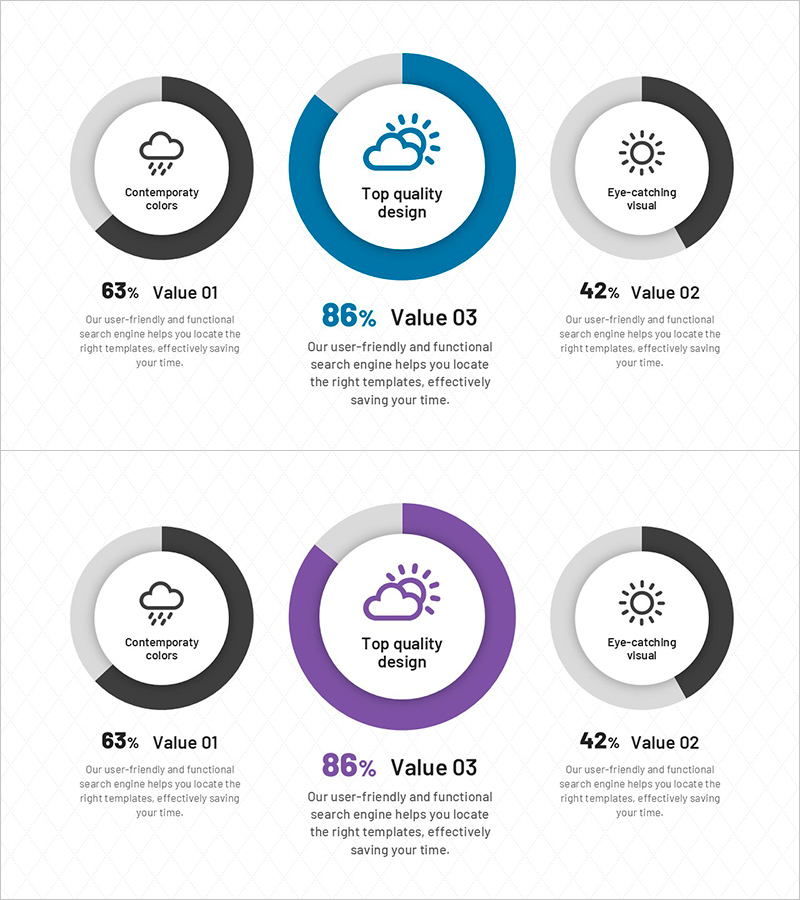
Weather Analysis Donut Chart – Visualizing Market Status and Share
RJ0600107_26
- Last Update 12/21/2025
- File Size 0.5MB
- # of Slides 2
- File Format PPTX
- Slide Ratio 16:9
- Color
Keywords
About the Product
This slide features a donut chart designed to visually represent weather analysis data. The harmonious combination of teal and purple colors emphasizes the importance of the information while providing a calm feel. This donut chart effectively conveys market share and status, making complex information easily understandable through data visualization. Users can efficiently present long-term climate change trends or specific weather-related data. This slide is particularly useful in various business contexts such as strategic presentations, marketing materials, and research result sharing.
Related Products
-
Graph of Sharp Drop in Sales – Scenarios of Loss and Recovery
#Financial Plans and Performance #Graph #Sales and Revenue
-

Rhombus Presentation Template Bar Chart – Market Analysis and Marketing Strategy
#Market and Competitor Analysis #Marketing Plan and Strategy #Graph
-

Global Market Share and User Growth Statistics – Popularity of AI Tools
#Market and Competitor Analysis #Graph #Market Status
-
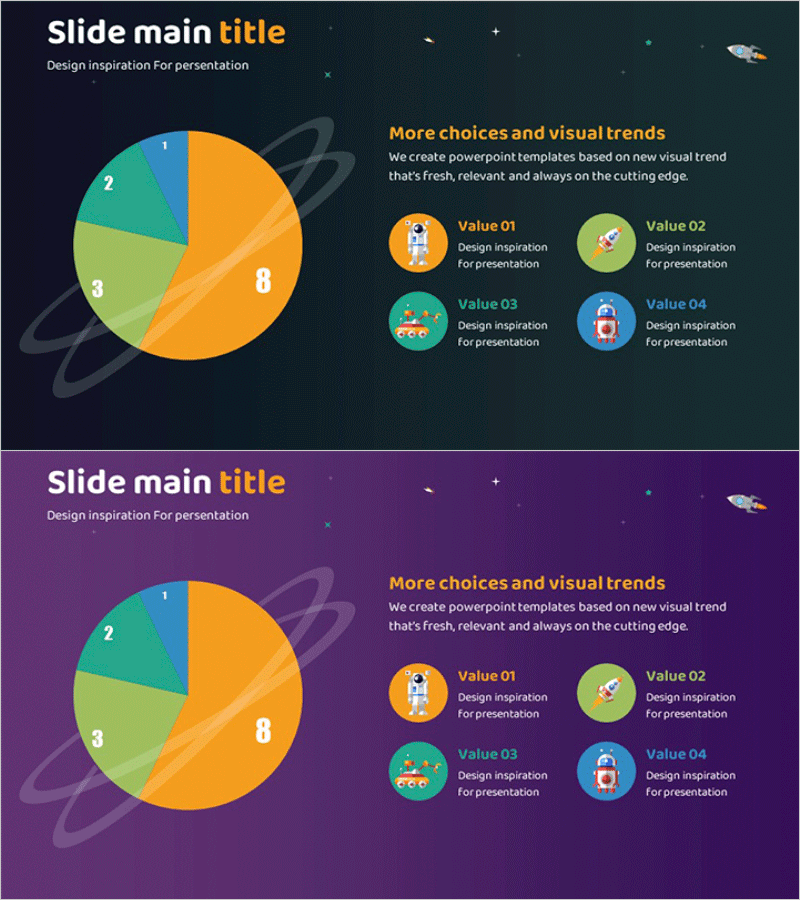
Space Industry Analysis Circular Graph
#Product/Service #Market and Competitor Analysis #Diagram
