Business Promotion Strategy
Eco-friendly Survey Graph – Environmental Protection and Data Utilization
RJ0600105_18
- Last Update 12/21/2025
- File Size 7.1MB
- # of Slides 2
- File Format PPTX
- Slide Ratio 16:9
- Color
Keywords
About the Product
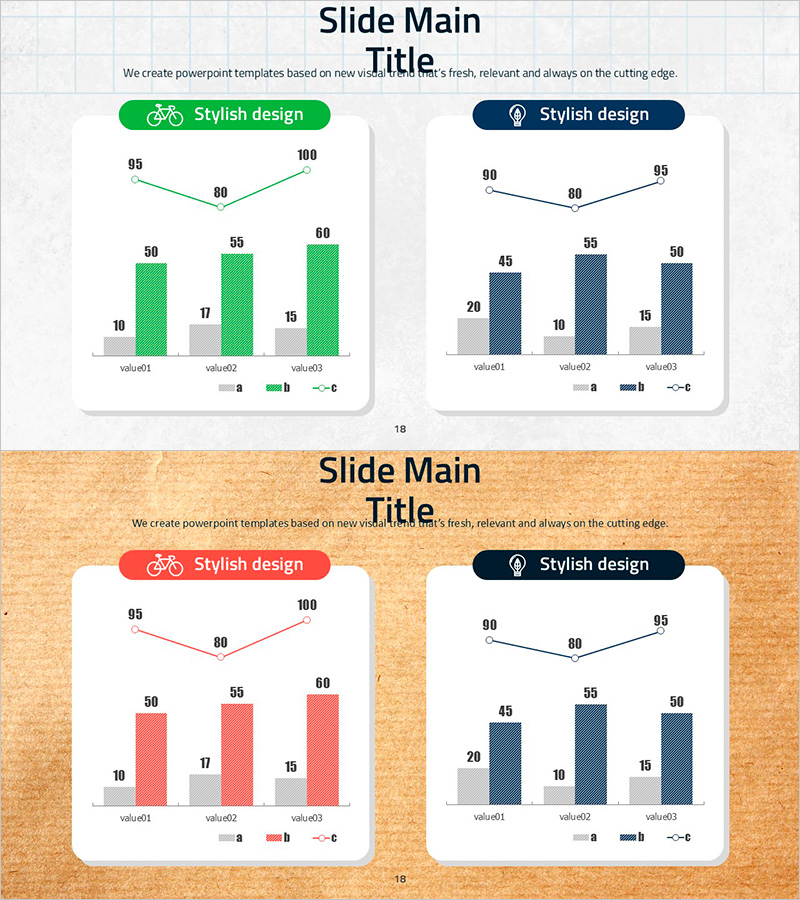
This slide features a graph designed to visually represent the results of an eco-friendly survey. Utilizing two distinct data visualization types effectively compares environmental initiatives. The use of green and red colors emphasizes the eco-friendly aspect and differentiates performance, with a clear layout for data presentation. Suitable for business strategy and market competition analysis, it is ideal for various environmental presentations and reports. The editing difficulty is rated 'easy', allowing for simple text and data substitutions.
Related Products
-
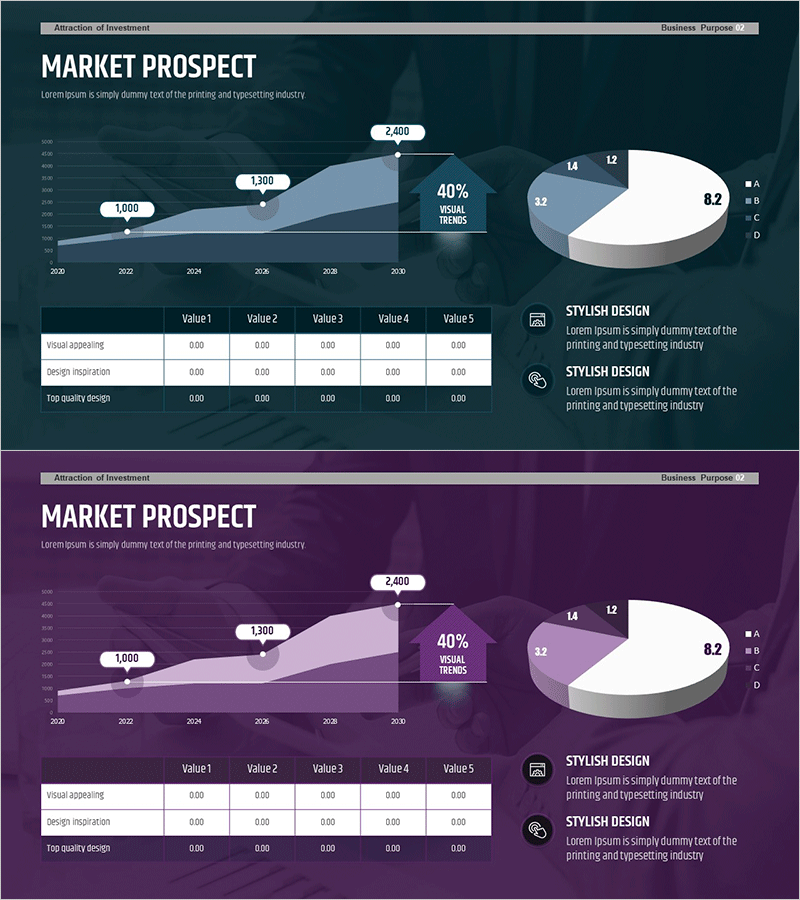
Industry Growth Rate and Trend Analysis Chart – Market Prospect
#Market and Competitor Analysis #Graph #Other
-
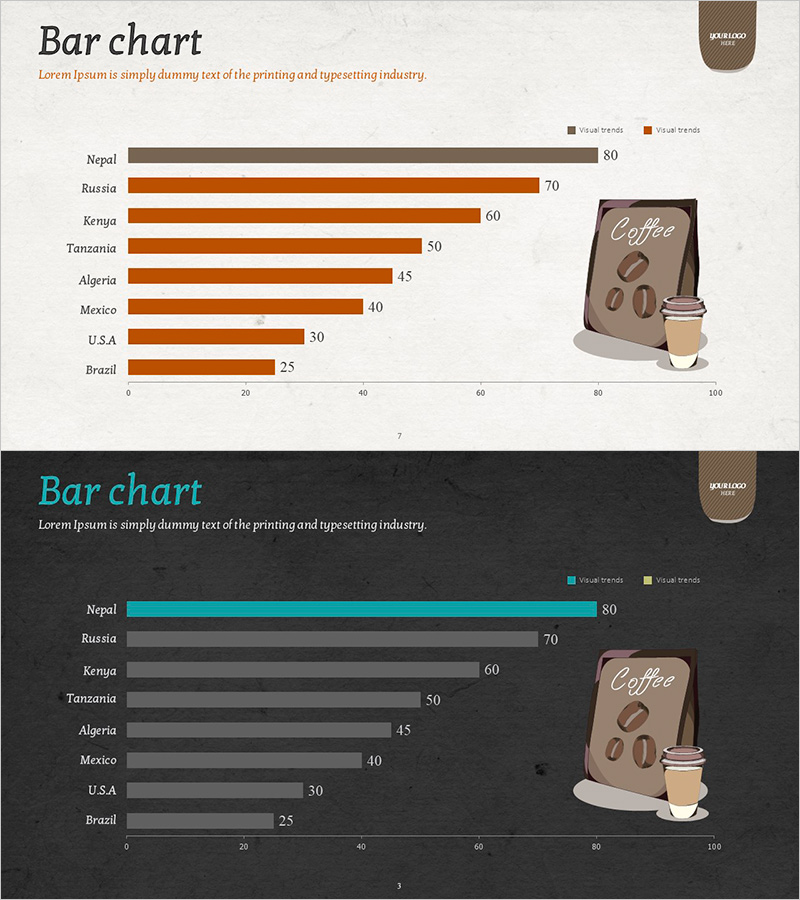
Bar Chart of Coffee Exports – Comparison and Performance
#Business Promotion Strategy #Market and Competitor Analysis #Graph
-
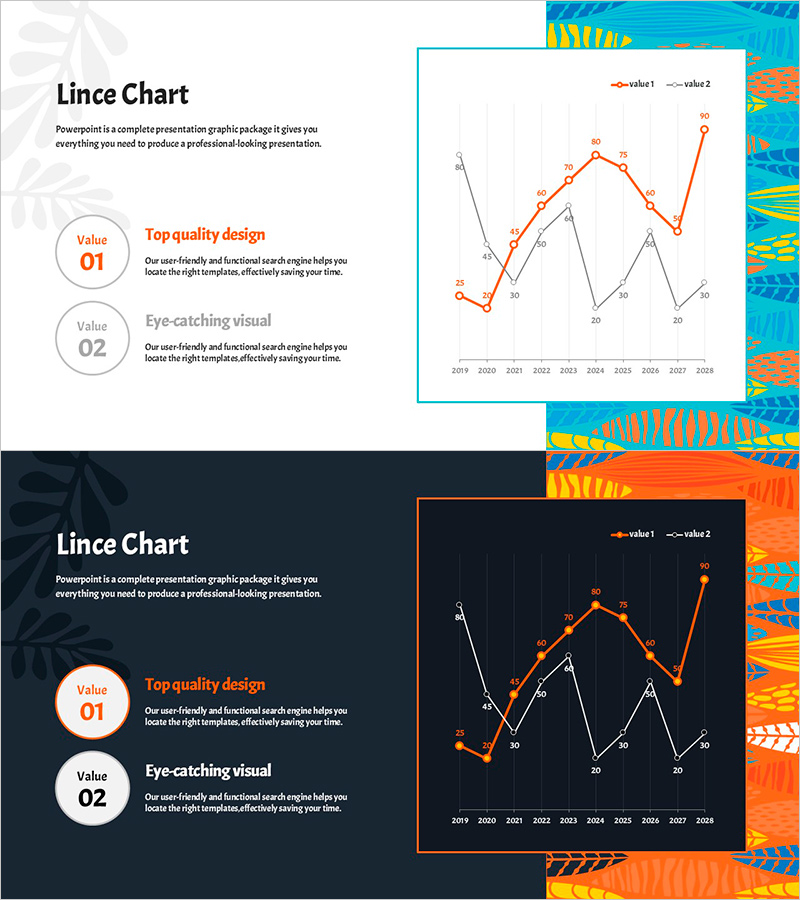
Trend of Comparison Items in Line Chart – Emphasizing Market Outlook
#Market and Competitor Analysis #Graph #Future Outlook
-
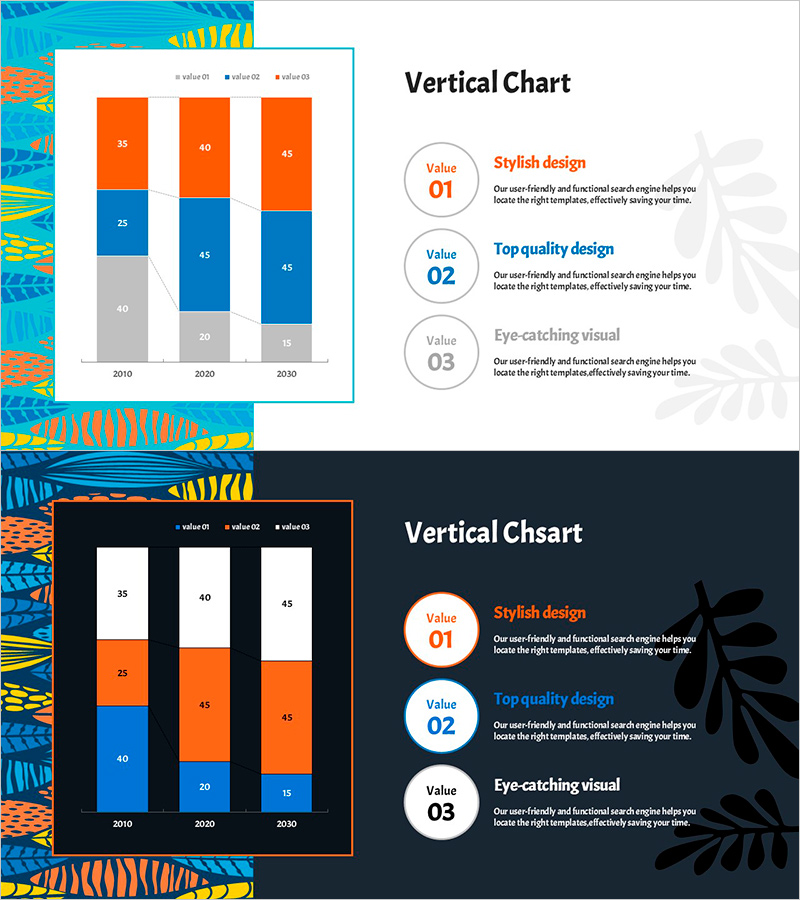
Summer Template Vertical Bar Segment Graph
#Market and Competitor Analysis #Graph #Industry Trends
