Business Promotion Strategy
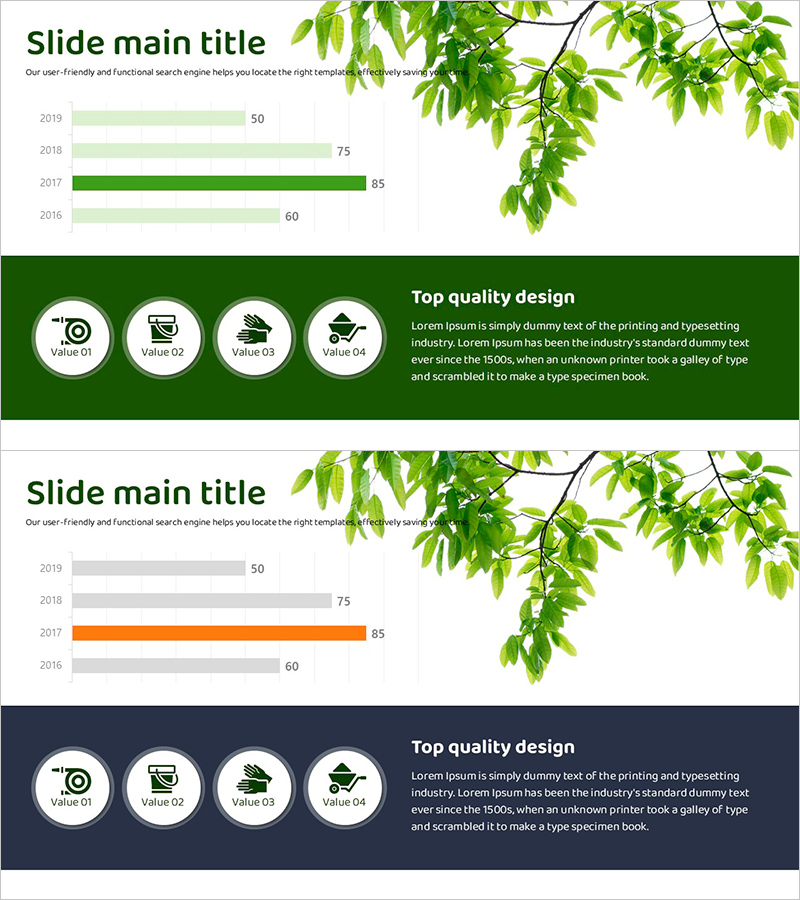
Bar Chart Analysis of Gardening Activities Trend – Performance and Competitive Advantage
RJ0600103_5
- Last Update 12/21/2025
- File Size 1MB
- # of Slides 2
- File Format PPTX
- Slide Ratio 16:9
- Color
Keywords
- #Content-Based Slides
- #Design-Based Slides
- #Business Promotion Strategy
- #Market and Competitor Analysis
- #Diagram
- #Graph
- #Achievements
- #Competitive Advantage
- #Cluster
- #Horizontal Bar
- #Closed Cluster Diagram
- #Horizontal Bar Chart
- #16:9
- #gardening activities
- #bar chart
- #performance
- #competitive advantage
About the Product
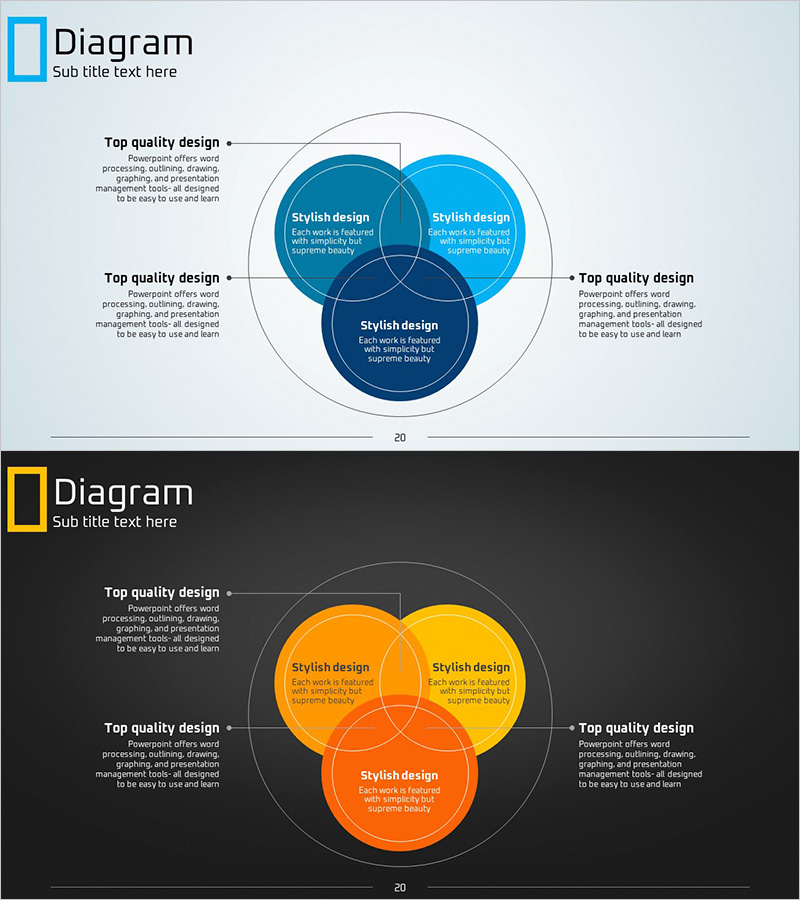
This slide utilizes a bar chart to visually depict the trend of gardening activities from 2016 to 2019. Using a color palette of green, navy, and orange, it emphasizes harmony with nature while clearly comparing results for each year. The slide is suited for business strategy and market analysis, effectively conveying the emotion of 'performance and competitive advantage'. The layout is concise and logically structured to facilitate audience understanding. With an editing difficulty rated as 'easy', it allows for quick application into various presentations through simple text and data input.
Related Products
-
Presentation Template for Marketing Strategy – Intuitive and Sleek Design
#Marketing Plan and Strategy #Diagram #Promotion Strategy
-
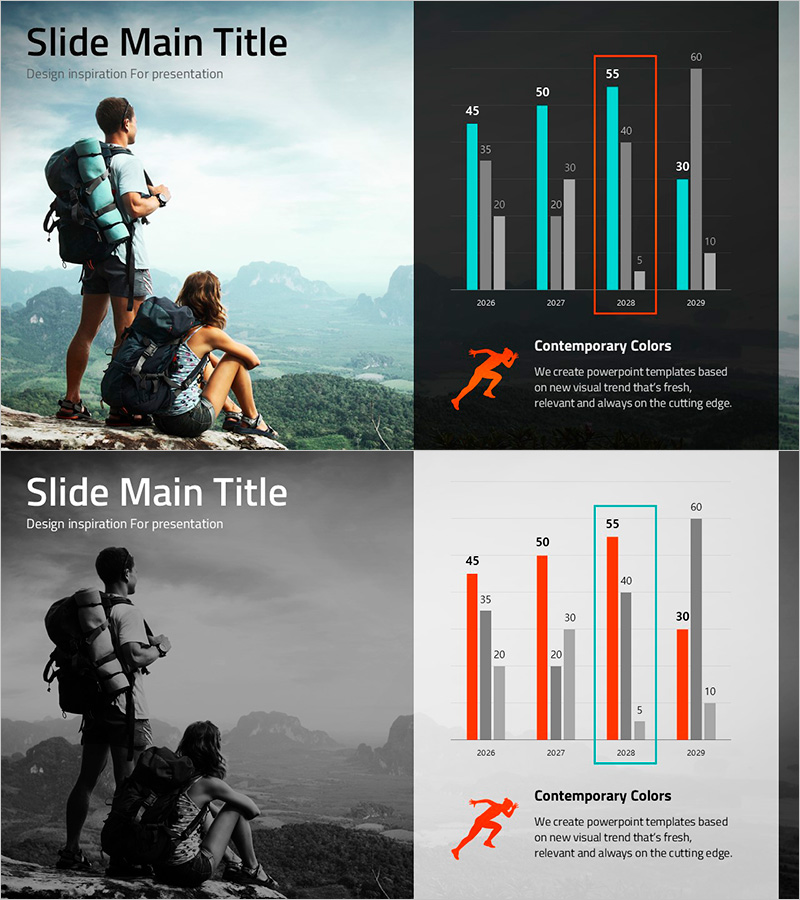
Climbing and Physical Strength Graph – Visualizing Market Analysis Results
#Market and Competitor Analysis #Graph #Market Analysis
-
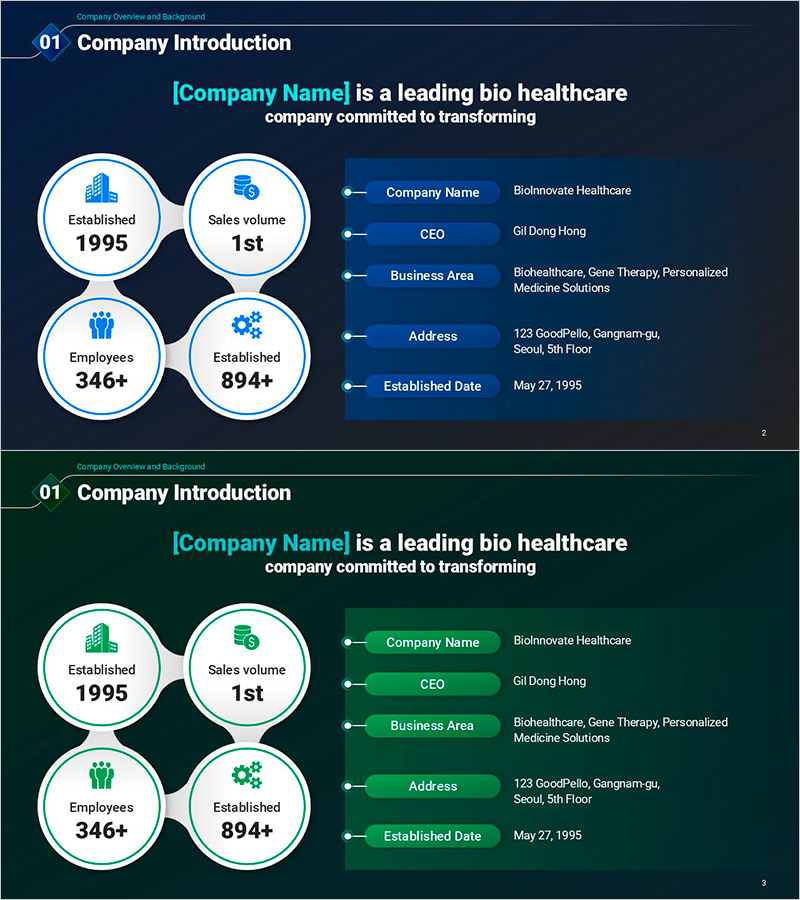
Company Status and Key Info Slide – Business Introduction and Trust
#Company Introduction #Diagram #Company Overview
-
Overlapping Diagram for Business Strategy Visualization – Blue and Yellow
#Business Vision and Strategy #Technology Sector #Diagram
