Overlapping Diagram for Business Strategy Visualization – Blue and Yellow
RJ0600026_19
- Last Update 06/27/2025
- File Size 0.3MB
- # of Slides 2
- File Format PPTX
- Slide Ratio 16:9
- Color
Keywords
- #Content-Based Slides
- #Design-Based Slides
- #Business Vision and Strategy
- #Technical Approach
- #Diagram
- #Business Strategy
- #Service Implementation Plan
- #Cluster
- #Combination Diagram
- #Inclusive Cluster Diagram
- #16:9
- #overlapping diagram PowerPoint
- #nested diagram slide
- #triple circle diagram
- #business strategy visualization
- #cluster diagram PPT
- #intersection diagram template
About the Product
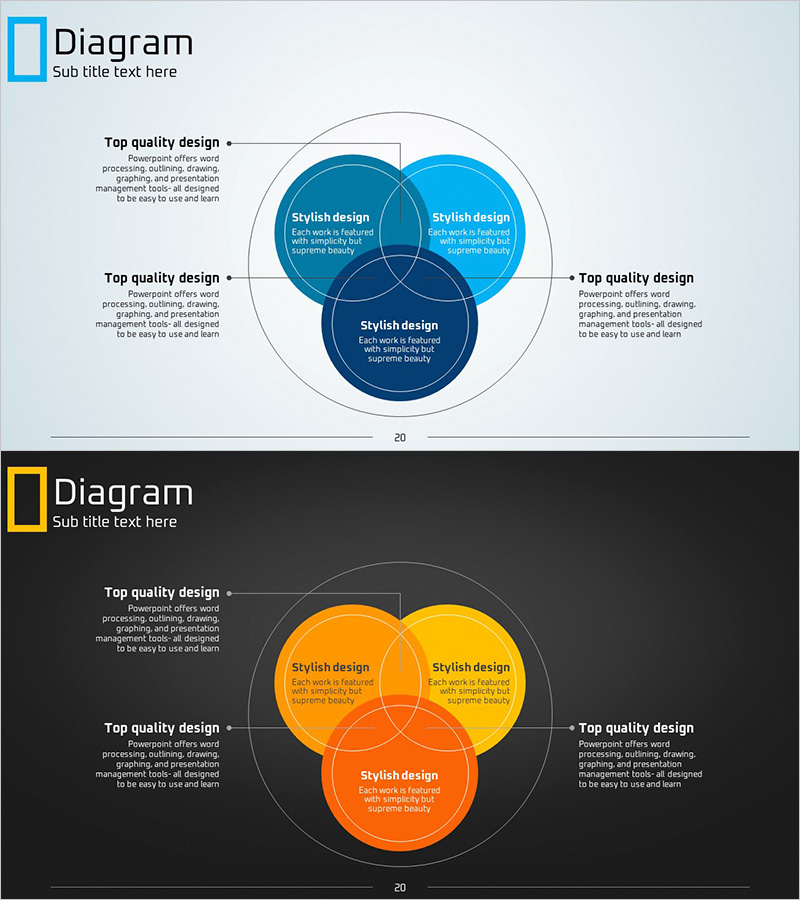
A professional PowerPoint slide featuring three overlapping circular nodes that visualize interconnected business strategy, technology division, and core values simultaneously. The gradient circles in light blue, dark blue, and yellow create intersection areas that intuitively convey mutual relationships and integrated strategy. Each node contains editable text areas for immediate customization across diverse topics including corporate strategy, technology roadmaps, and organizational capabilities. The 2-slide set includes both light and dark background versions, allowing you to select the optimal design for your presentation environment. This slide deck is specifically optimized for clearly visualizing complex relationships and interactions in business presentations.
Usage Points
-
Main Usage
Visually represents three or more interconnected elements (strategy-technology-capability, or organization-process-performance) and their intersection relationships. Highly effective for executive briefings, strategic planning presentations, organizational capability analysis, and technology roadmap demonstrations where complex relationships must be understood at a glance.
-
How to Use
Enter topic-specific content into the text areas within each circular node, and adjust colors and sizes as needed to emphasize importance. Use the light background slide in bright conference rooms and the dark background slide in large auditoriums to maximize readability and visual impact.
-
Recommended For
Executive and C-suite strategy presentations, cross-departmental collaboration explanations, technology organization capability integration briefings, consulting firm strategic proposals, and interdisciplinary research project introductions at academic institutions.
-
Slide Structure
Composed of three overlapping circular nodes positioned at top-left (light blue), top-right (yellow), and bottom (dark blue), with intersection areas representing integrated strategy. Descriptive text areas labeled 'Top quality design' are positioned on both left and right sides. Both slides maintain identical structure with only background color variation.
Related Products
-

Visualizing Business Strategies with Triangular Overlap and Nested Diagrams
#Business Vision and Strategy #Marketing Plan and Strategy #Diagram
-

Tricolor Overlapping Diagram – Business Strategy Representation
#Business Vision and Strategy #Technical Approach #Diagram
-

Coffee Bean Overlap Diagram – Business Strategy and Service Composition
#Business Vision and Strategy #Technical Approach #Diagram
-

Systematic Nested Diagram – Business Strategy Visualization
#Business Strategy #Technical Approach #Diagram
