Business Promotion Strategy
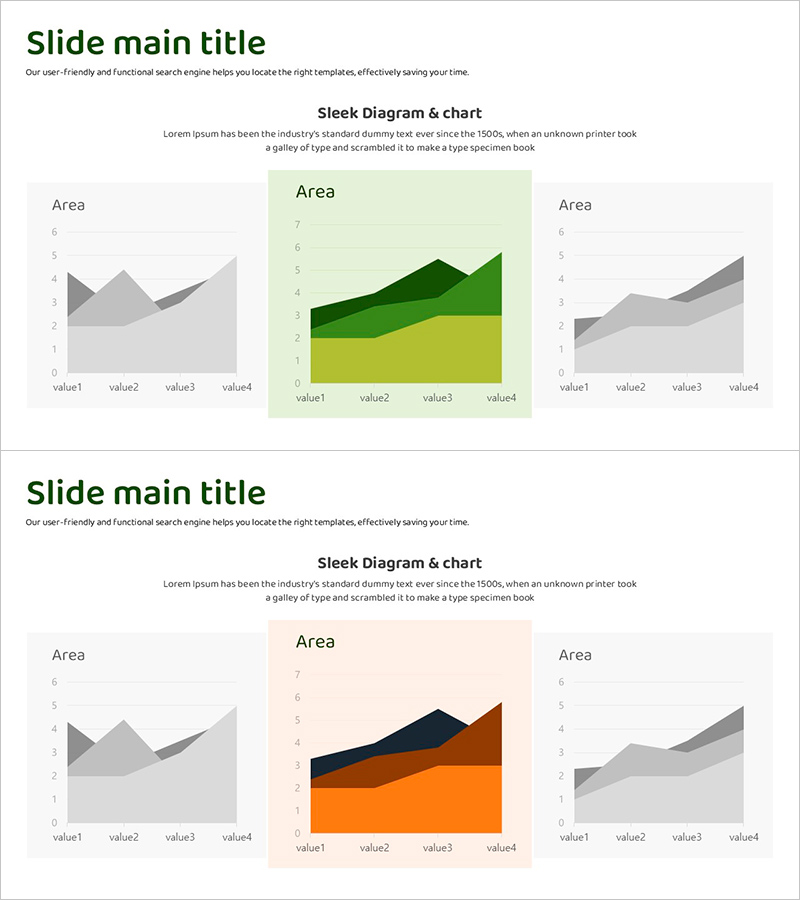
Selected Area Graphs – Market and Performance Analysis
RJ0600103_28
- Last Update 12/21/2025
- File Size 0.4MB
- # of Slides 2
- File Format PPTX
- Slide Ratio 16:9
- Color
Keywords
About the Product
This slide effectively visualizes market and performance analysis using selected area graphs. The smooth design with gradient effects clearly conveys data and enhances communication efficiency. This slide is perfect for business strategy presentations and market analysis reports, with a combination of green, orange, and brown colors adding to the trustworthiness. It can be easily utilized in internal team meetings or external presentations, and text and data replacements are facilitated through a simple editing structure.
Related Products
-
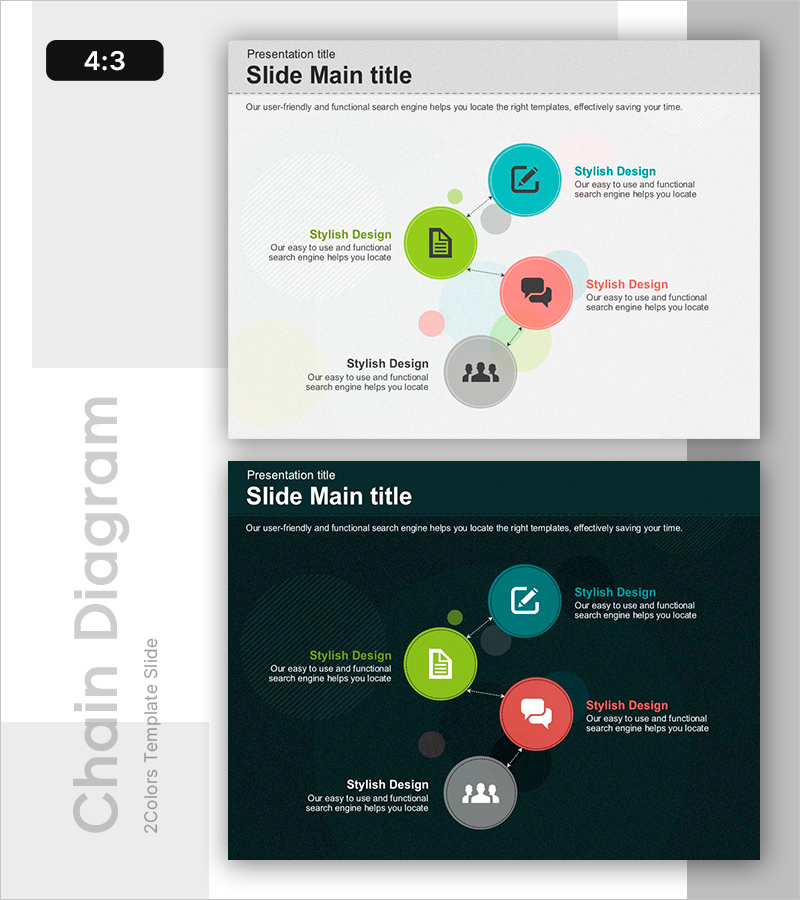
Interlinked Business Plans – Strategy and Execution
#Product/Service #Business Promotion Strategy #Diagram
-
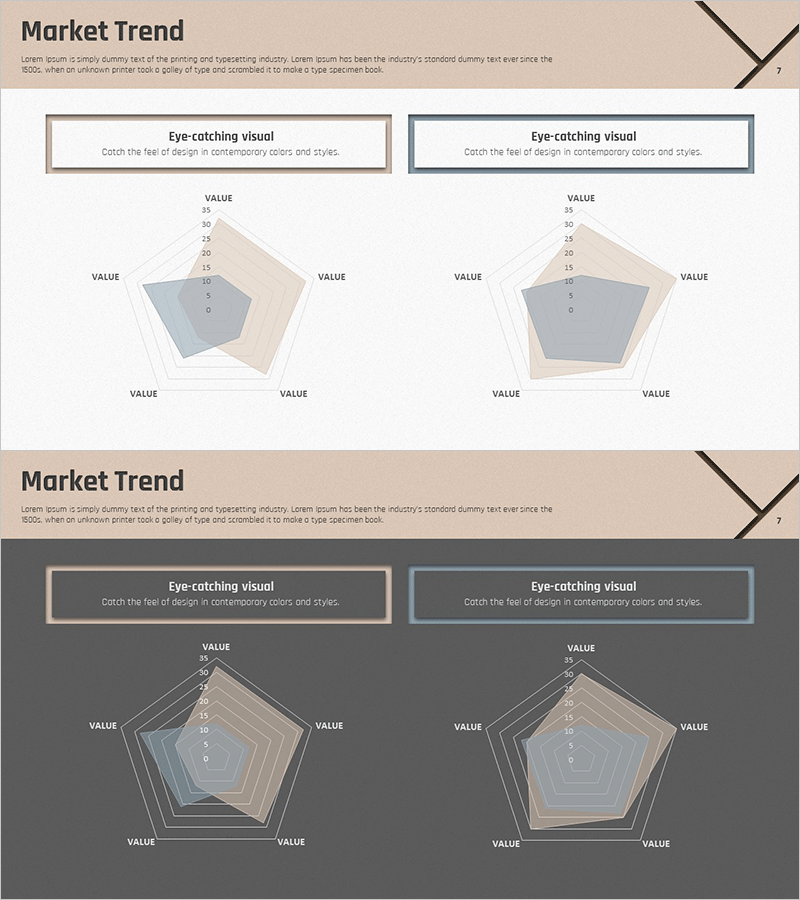
Market Trend Analysis Radial Graph – Connecting Data Visually
#Graph
-
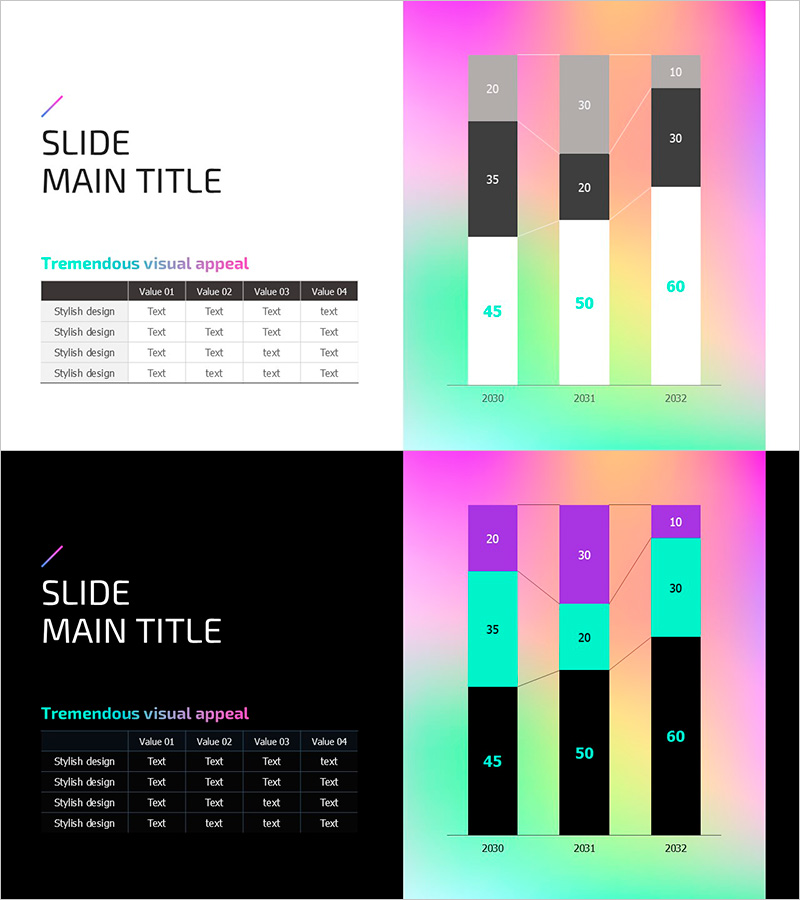
Hologram Wide PPT Table & Segmentation Bar Graph – Trendy Data Visualization
#Market and Competitor Analysis #Financial Plans and Performance #Diagram
-
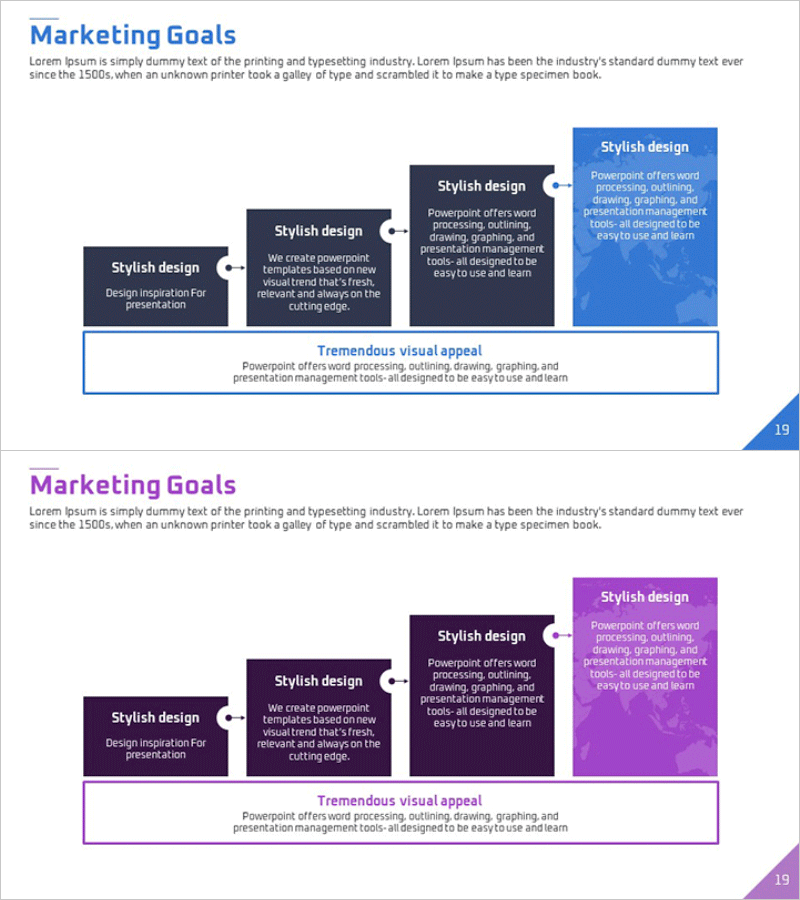
Step-by-step Goal Diagram – Visualizing Business Strategies and Marketing Goals
#Business Promotion Strategy #Marketing Plan and Strategy #Diagram
