Product/Service
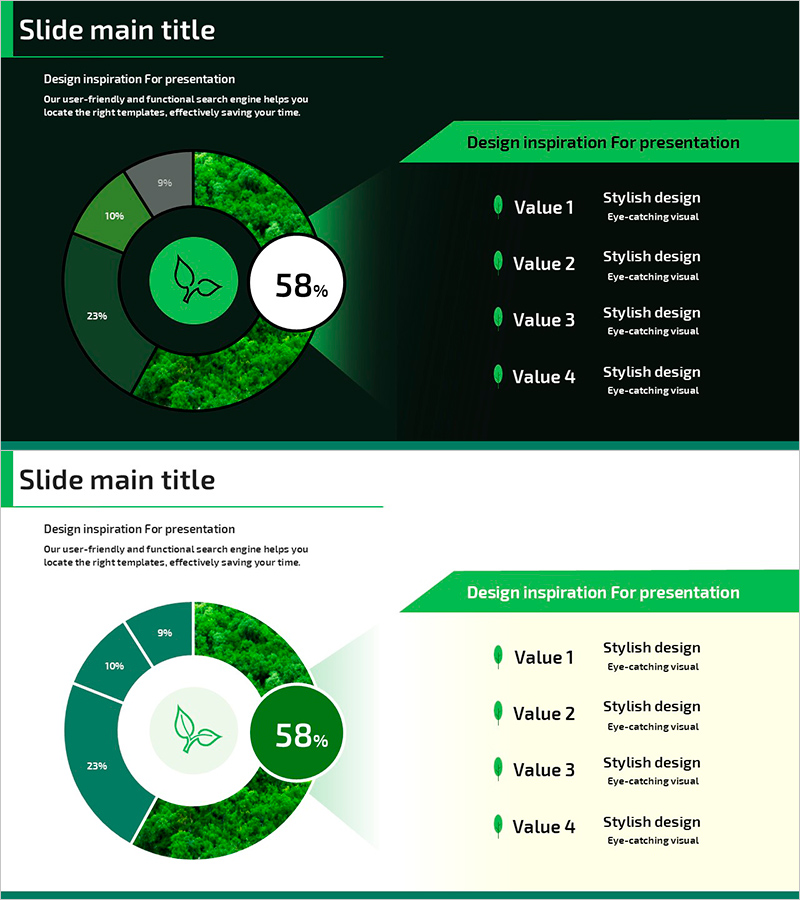
Visualizing Major Plant Composition with Donut Chart
RJ0600099_5
- Last Update 12/21/2025
- File Size 0.9MB
- # of Slides 2
- File Format PPTX
- Slide Ratio 16:9
- Color
Keywords
About the Product
This slide features a donut chart to intuitively express the composition ratios of major plants. It allows for easy insight into each component's share, making it suitable for market analysis and competitor analysis materials. The green palette conveys a nature-friendly impression, ideal for topics emphasizing eco-sourcing and sustainability. This slide aids in effectively communicating key data to investors while being easy to edit, ensuring quick content adaptation.
Related Products
-
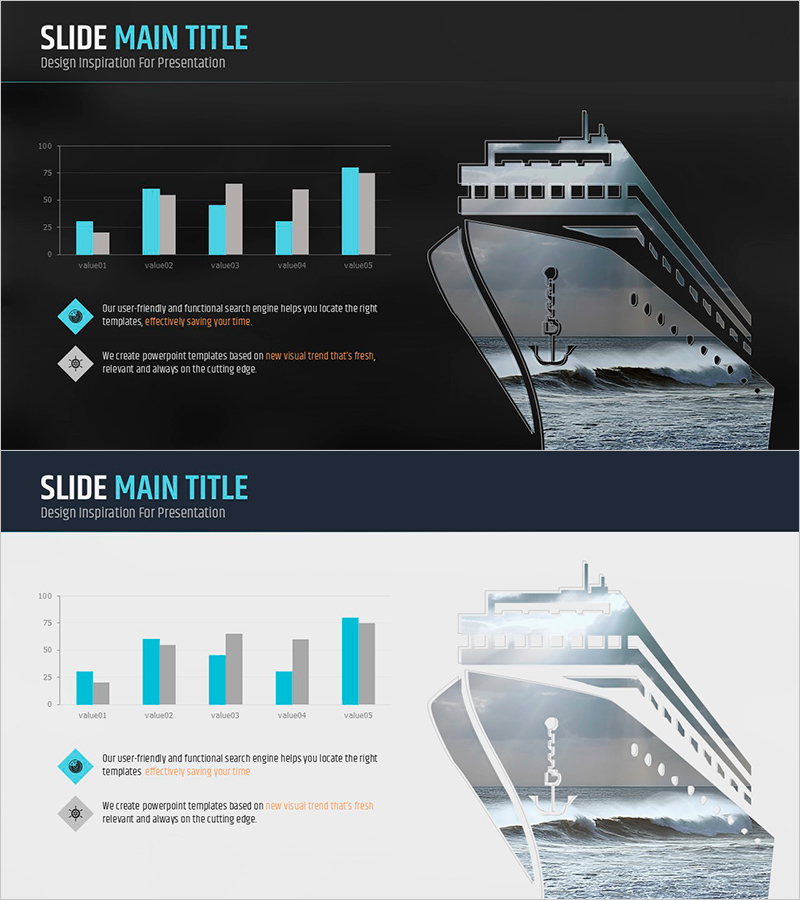
Analysis of Ship Order Volume – Effective Market Status Graph
#Market and Competitor Analysis #Financial Plans and Performance #Graph
-
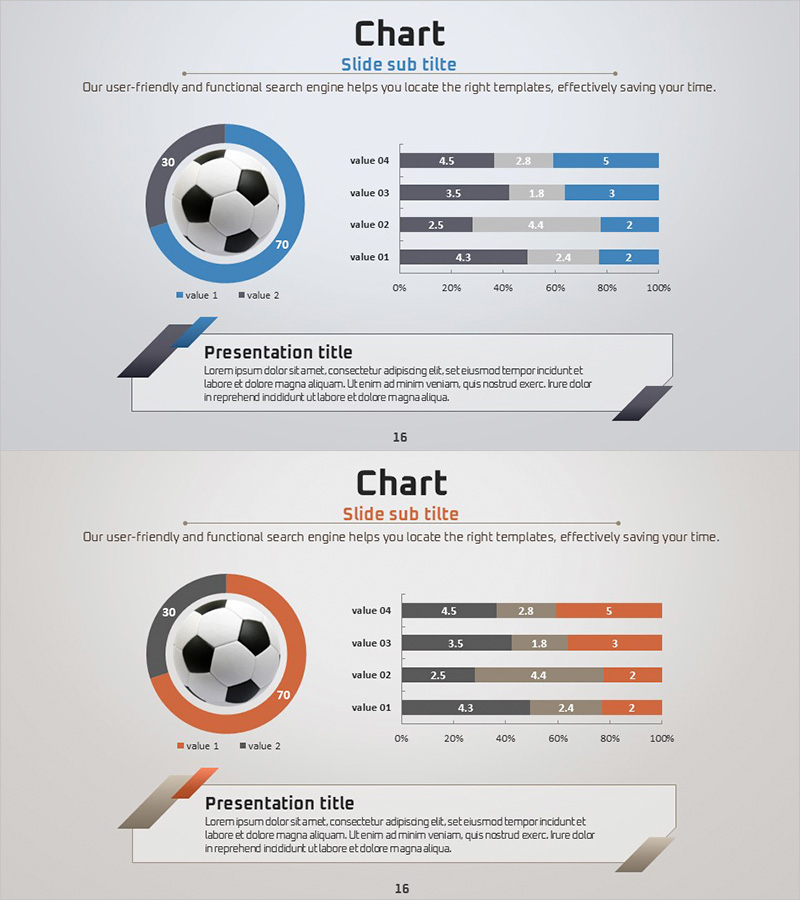
Soccer Match Analysis Chart – Performance Analysis and Future Forecast
#Business Vision and Strategy #Market and Competitor Analysis #Graph
-
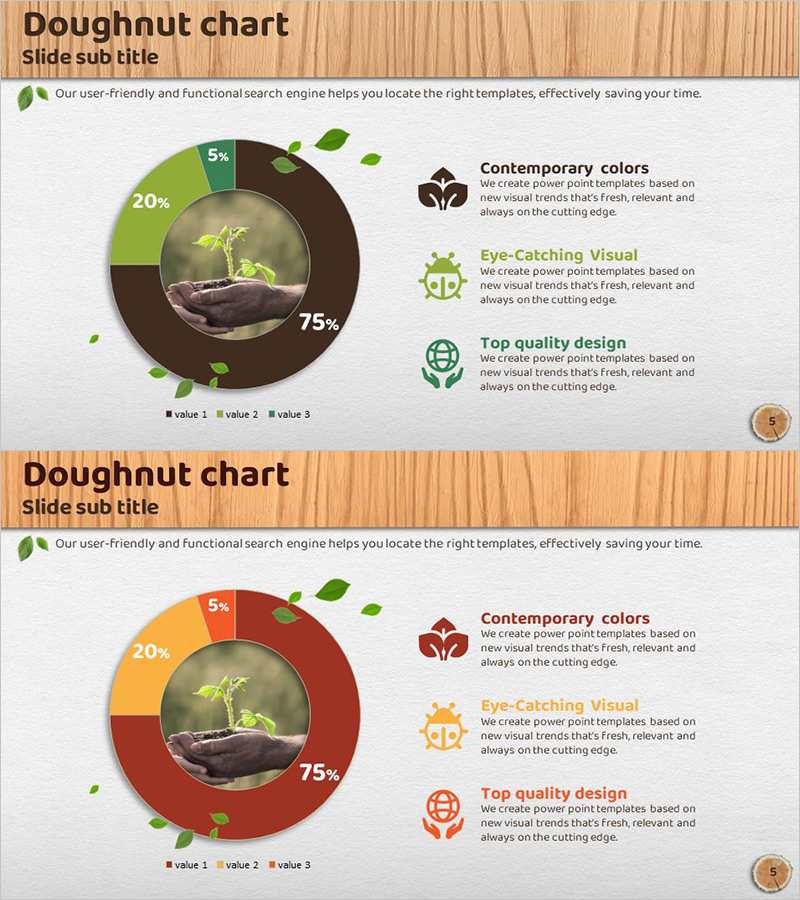
Market Share Donut Chart for Eco-Friendly Businesses – Trends and Insights
#Market and Competitor Analysis #Graph #Market Share
-
Post-it Tweezers Message for Visualizing Customer Feedback
#Product/Service #Customer Success Stories #Diagram
