Market and Competitor Analysis
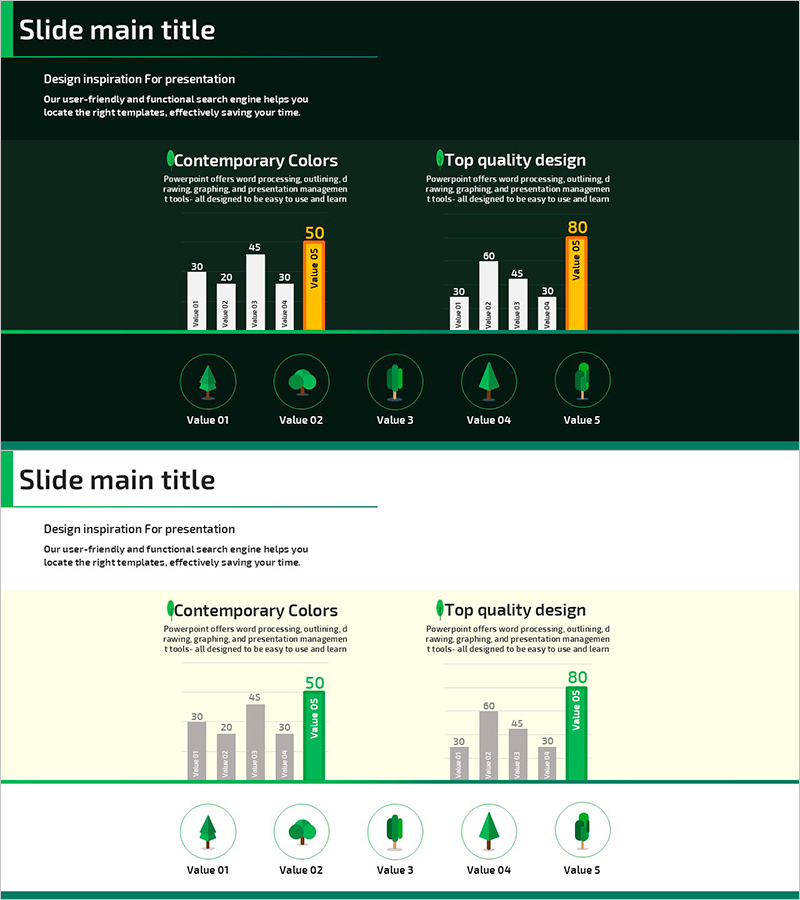
Tree Population Graph – Visualizing Competitive Advantages
RJ0600099_15
- Last Update 12/21/2025
- File Size 0.3MB
- # of Slides 2
- File Format PPTX
- Slide Ratio 16:9
- Color
Keywords
About the Product
This slide features a graph utilizing horizontal and vertical bars to visually represent tree population metrics. Optimized for market and competitive analysis, it offers a vibrant combination of yellow and green to convey an eco-friendly feel. Each data point is clearly designed for easy comparison, making it ideal for presentations and reports. The chart format allows for quick data substitution with an editing difficulty rated as 'easy', suitable for anyone to modify.
Related Products
-
Customer Rating Percentage Infographic Chart for Programs
#Product/Service #Market and Competitor Analysis #Graph
-
Business Proposal Presentation Template
#Product/Service #Market and Competitor Analysis #Benefits and Advantages
-
Bundled Charts for Infinite Energy Analysis
#Market and Competitor Analysis #Graph #Market Status
-
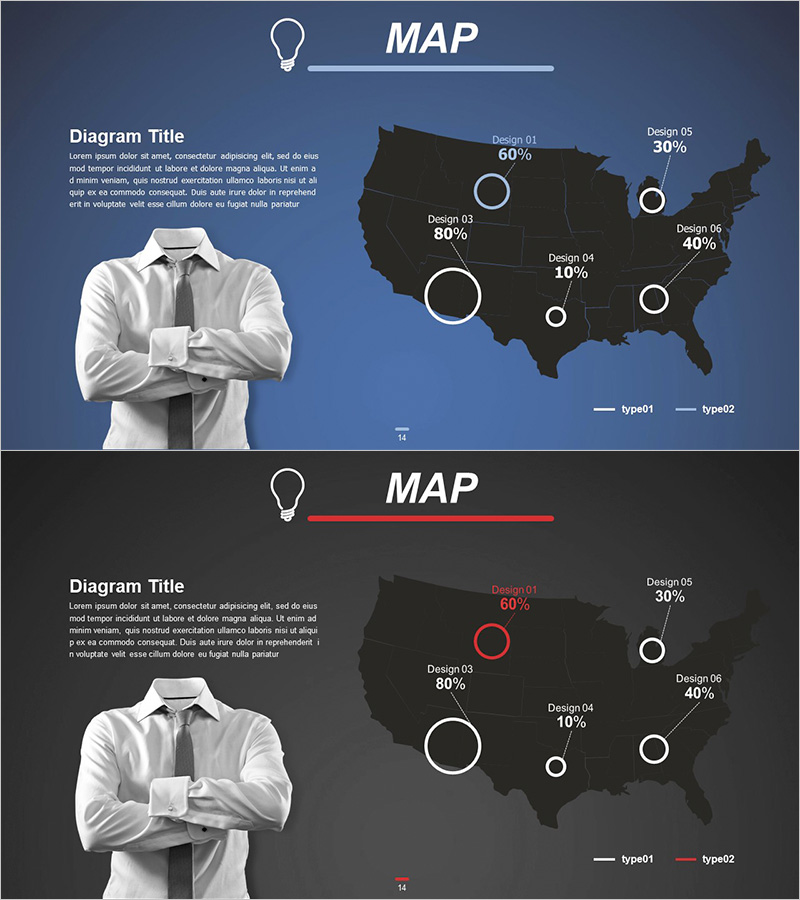
US Target Market Map for Marketing Analysis
#Market and Competitor Analysis #Marketing Plan and Strategy #Graph
