Company Introduction
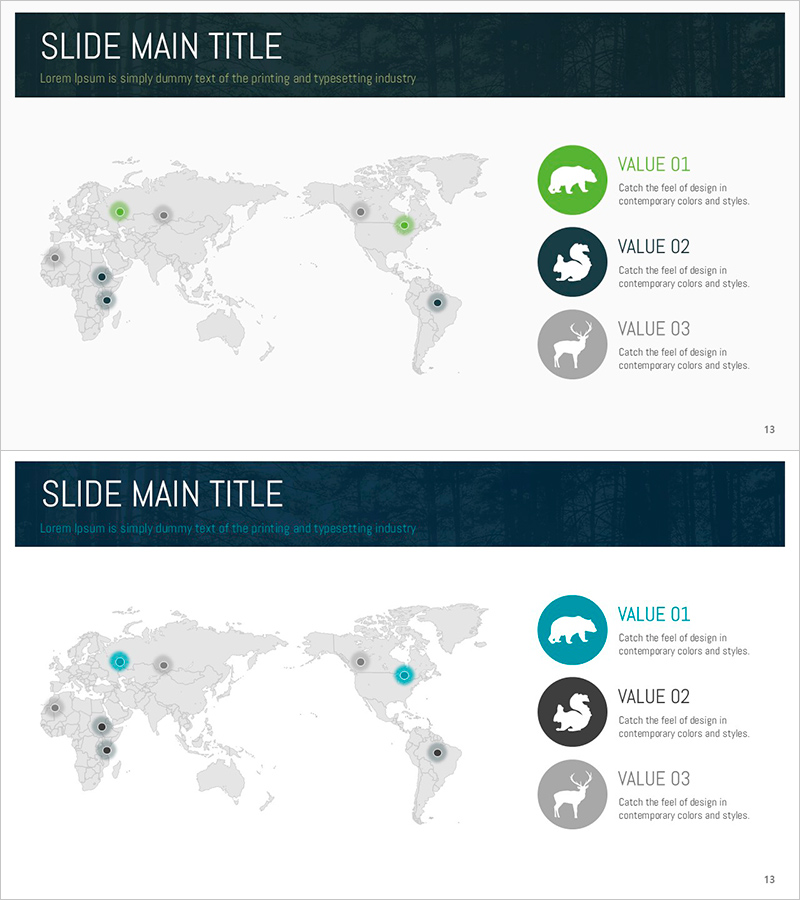
Animal Distribution Map – Market and Competitive Analysis
RJ0600087_13
- Last Update 12/21/2025
- File Size 3.9MB
- # of Slides 2
- File Format PPTX
- Slide Ratio 16:9
- Color
Keywords
About the Product
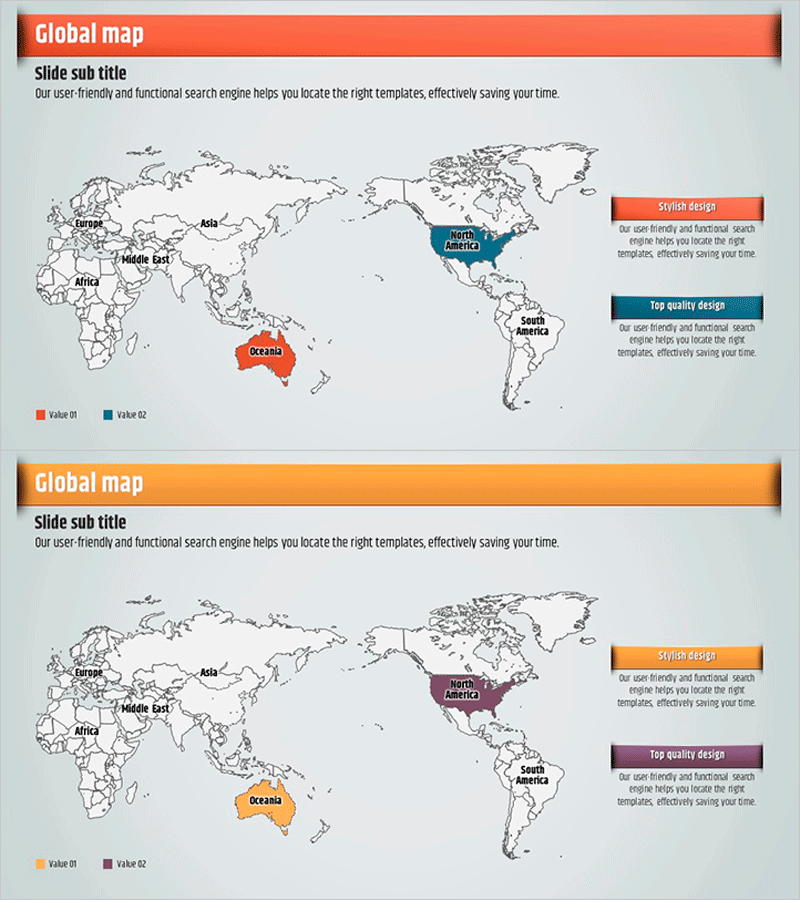
This slide features a visual map of animal distribution, ideal for market and competitive analysis presentations. The combination of green and teal colors symbolizes nature and the environment, enhancing the clarity of information delivery. This slide expresses global networks while ensuring readability of data. Icons representing animals emphasize the characteristics of specific regions, effectively conveying information about their distribution. It can be notably useful in strategizing business expansions or reporting on ecological data.
Related Products
-
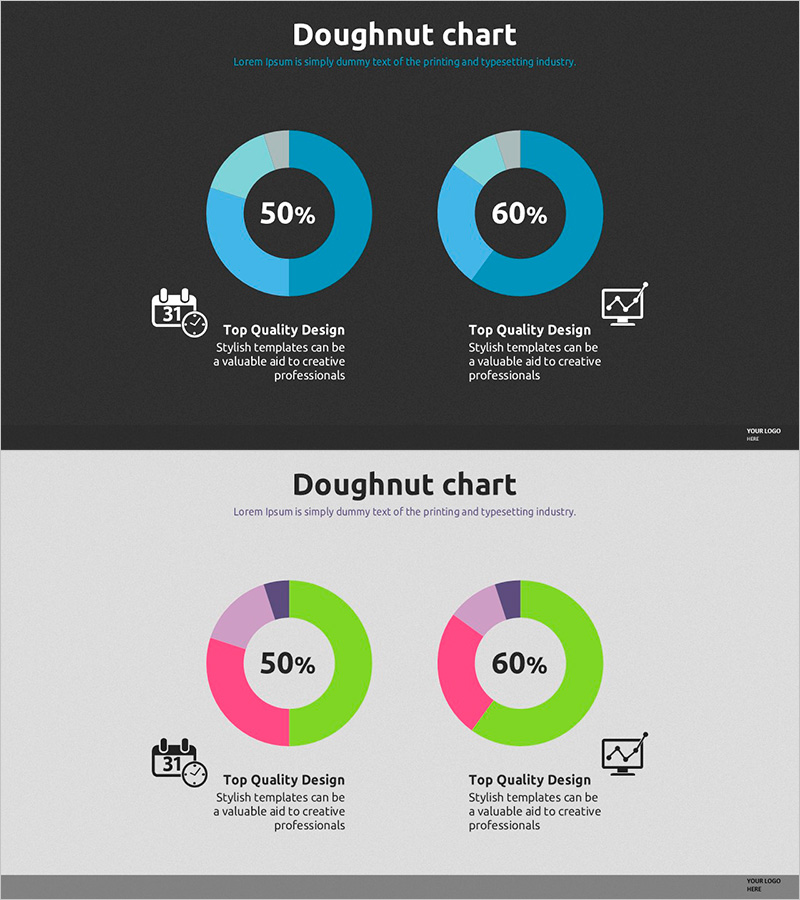
Two Types of Donut Charts – Effective Market Analysis Tool
#Market and Competitor Analysis #Graph #Market Analysis
-
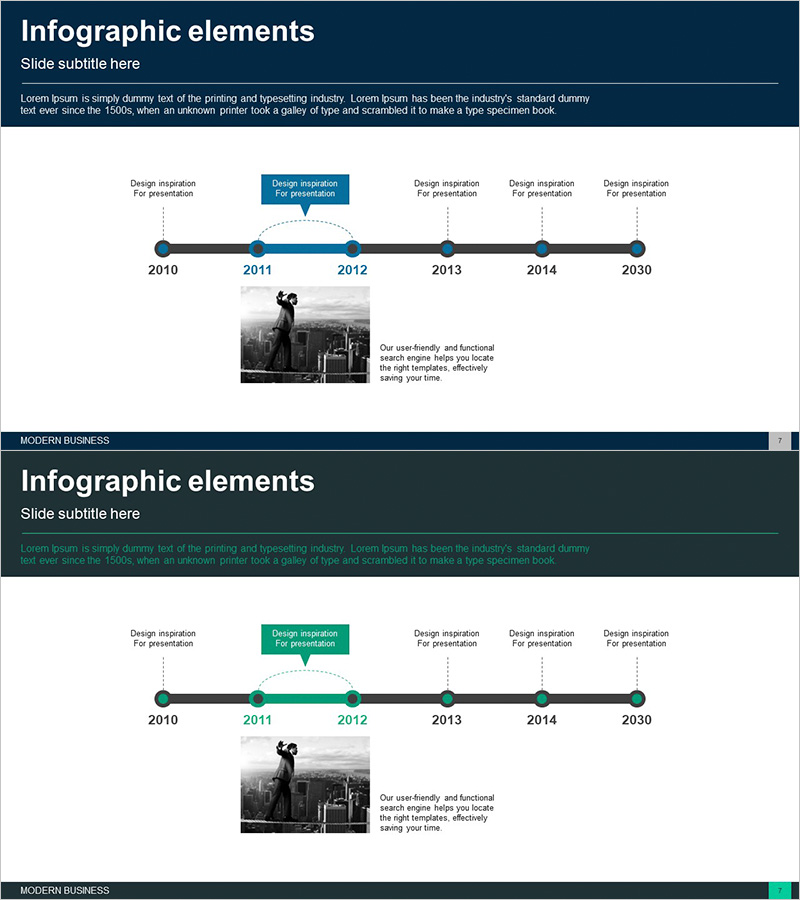
Business History Connection Diagram – Company Growth Story
#Company Introduction #Diagram #History
-
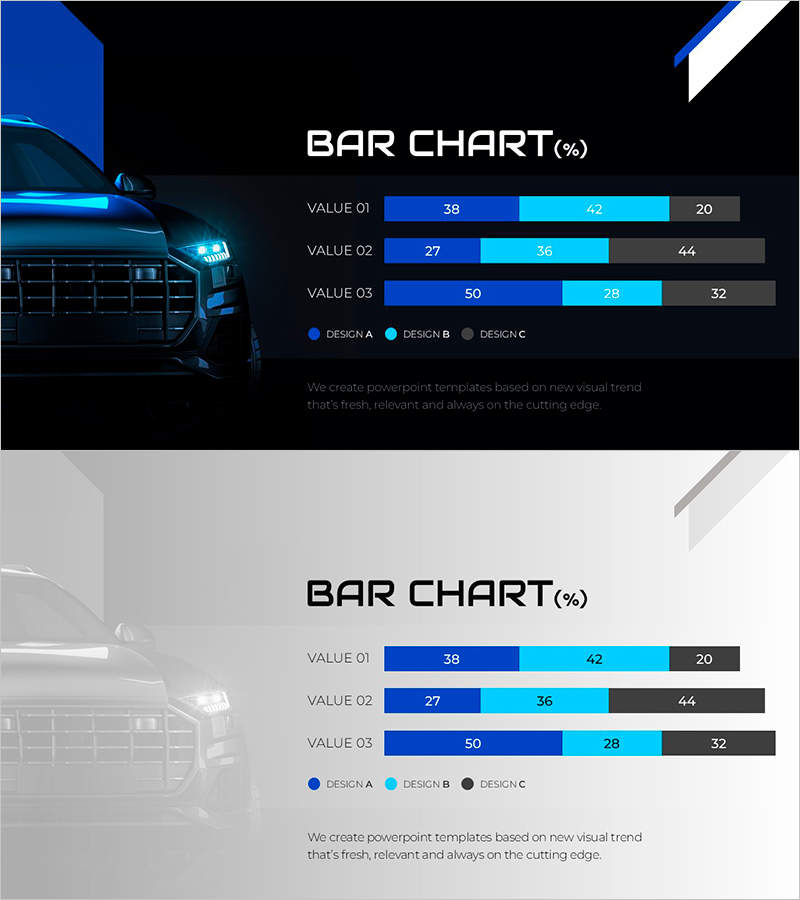
Vehicle Sales Trends Visualized with Horizontal Bar Chart
#Market and Competitor Analysis #Financial Plans and Performance #Graph
-
Global Map Presentation Template for Idea Generation
#Company Introduction #Other #Global Network
