Business Promotion Strategy
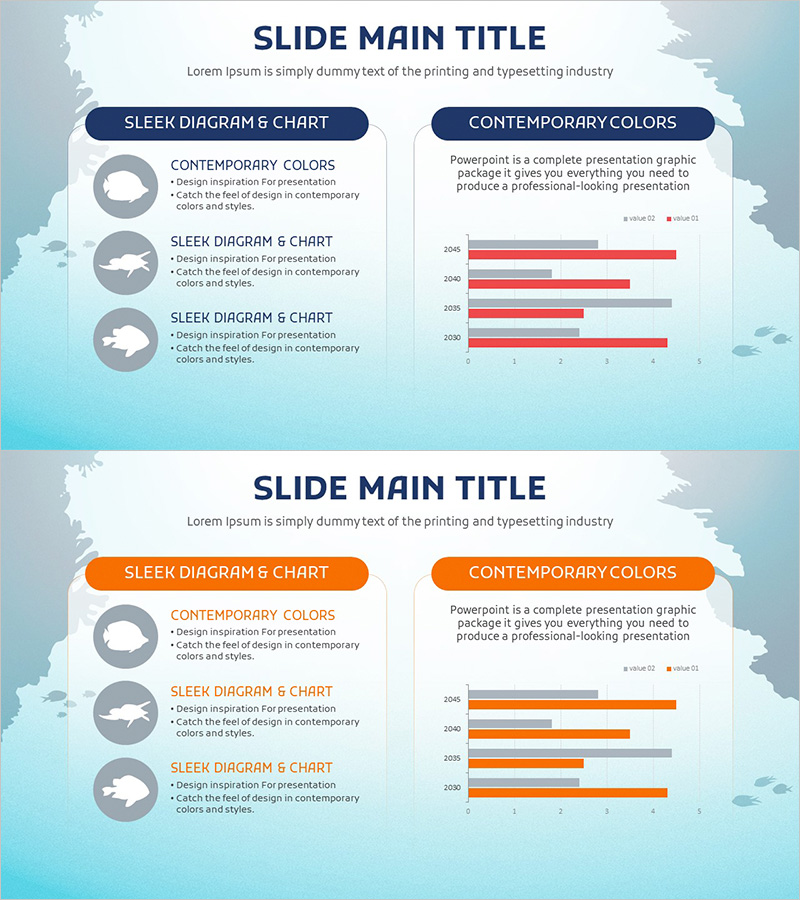
Sea Life Population Graph – Emphasizing Results Through Data Visualization
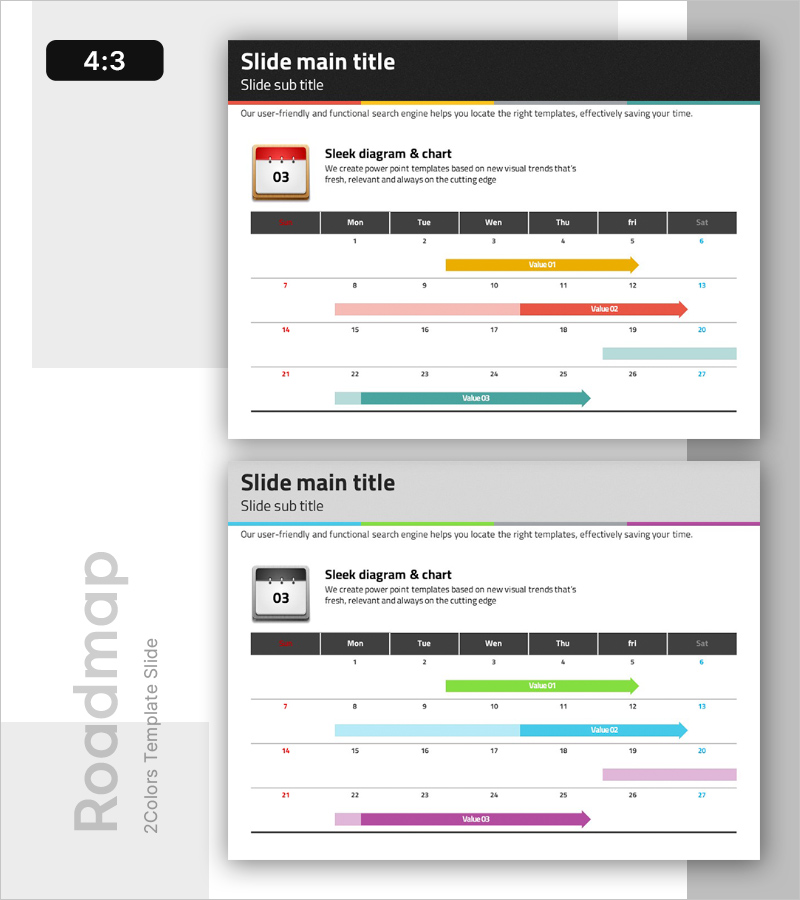
RJ0600081_28
- Last Update 12/21/2025
- File Size 1.8MB
- # of Slides 2
- File Format PPTX
- Slide Ratio 16:9
- Color
Keywords
About the Product
This slide utilizes a horizontal bar chart to visually represent changes in marine species populations. The vibrant shades of red and orange are designed to capture the audience's attention while emphasizing results. The slide features an inclusive cluster design, helping to easily identify trends for each category. It is optimized for use in business strategy meetings or environmental presentations, with a low editing difficulty for text and data replacement, rated as 'easy'.
Related Products
-
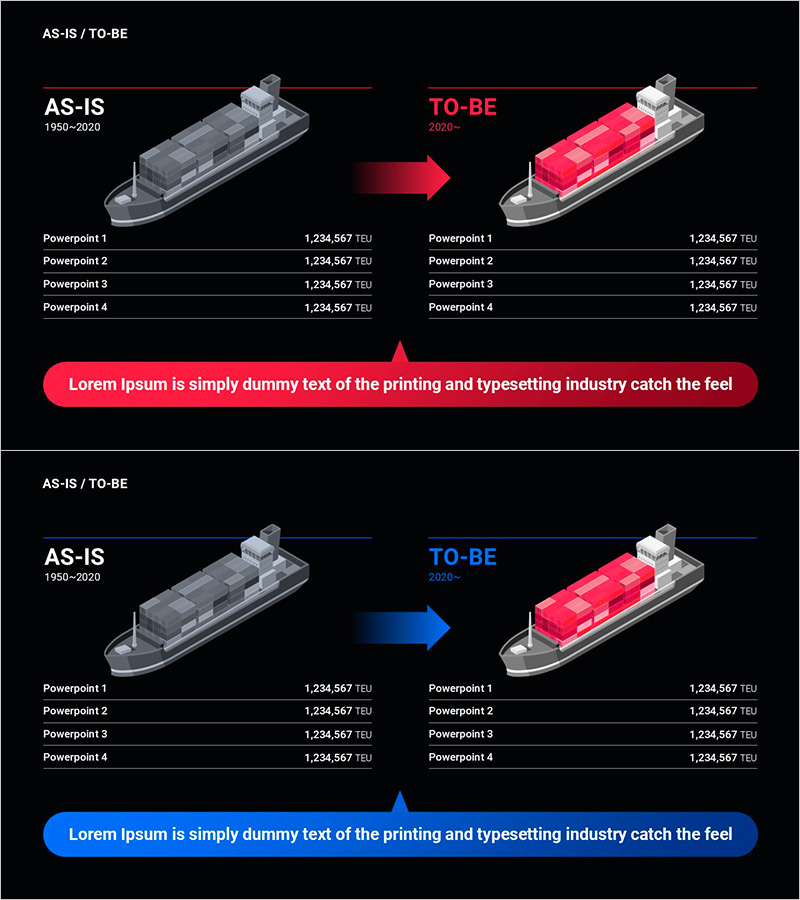
Shipping Logistics Improvement Roadmap Slide
#Business Promotion Strategy #Operation Plan #Text Box
-
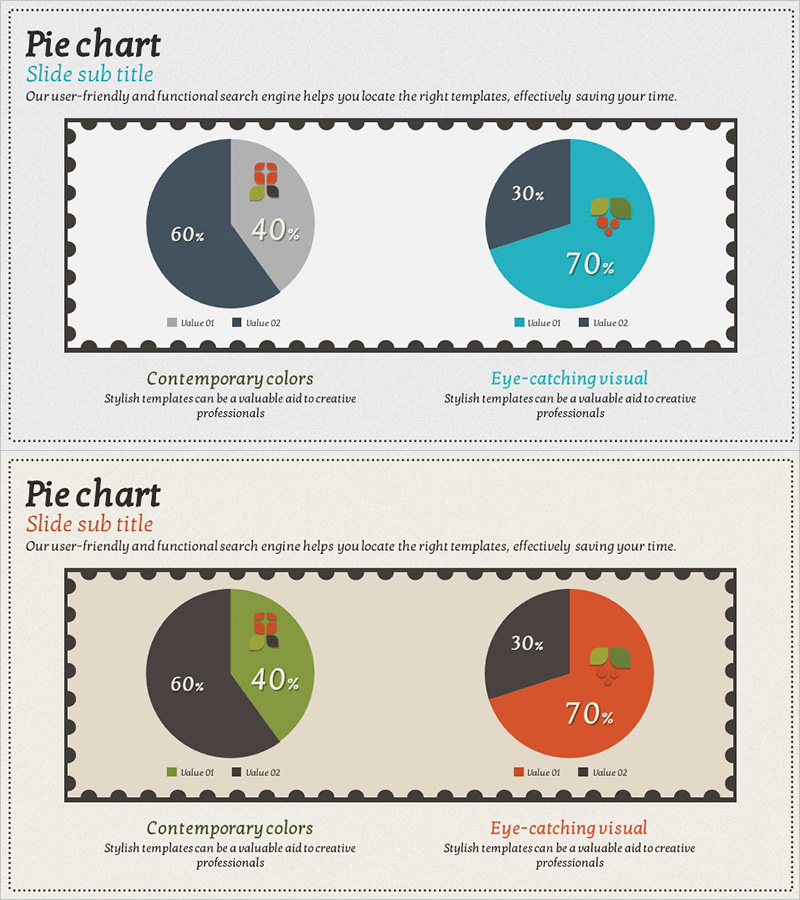
Market Share Circle Graph – Ideal for Market Analysis
#Market and Competitor Analysis #Graph #Market Share
-
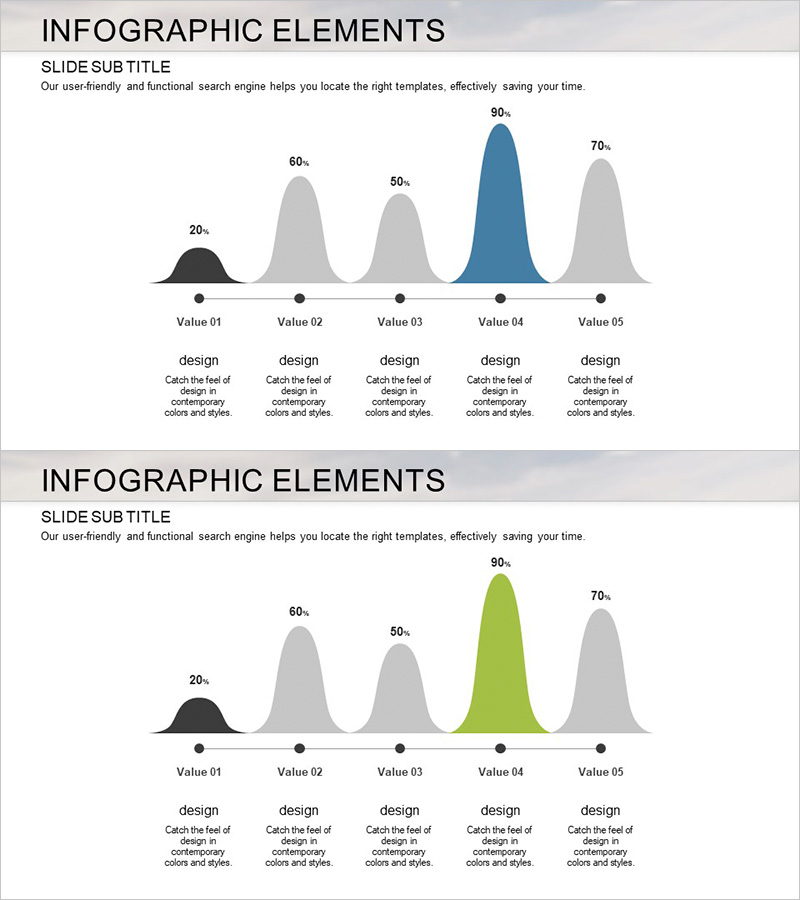
Curved Area Graph for Market Analysis Visualization – Insights Provided
#Market and Competitor Analysis #Diagram #Graph
-
Timeline Plan for Strategic Execution – Business Implementation Strategy Diagram
#Business Promotion Strategy #Diagram #Roadmap
