Shipping Logistics Improvement Roadmap Slide
RM0700013_10
- Last Update 02/27/2025
- File Size 1.2MB
- # of Slides 4
- File Format PPTX
- Slide Ratio 16:9
- Color
Keywords
- #Content-Based Slides
- #Design-Based Slides
- #Business Strategy
- #Operational Plan
- #Text Box
- #As-Is To-Be
- #Production and Technology Development Strategy
- #Speech Bubble
- #16:9
- #shipping logistics improvement PowerPoint slide
- #As-Is To-Be comparison slide
- #logistics strategy PPT
- #comparative roadmap presentation
- #maritime industry slides
About the Product
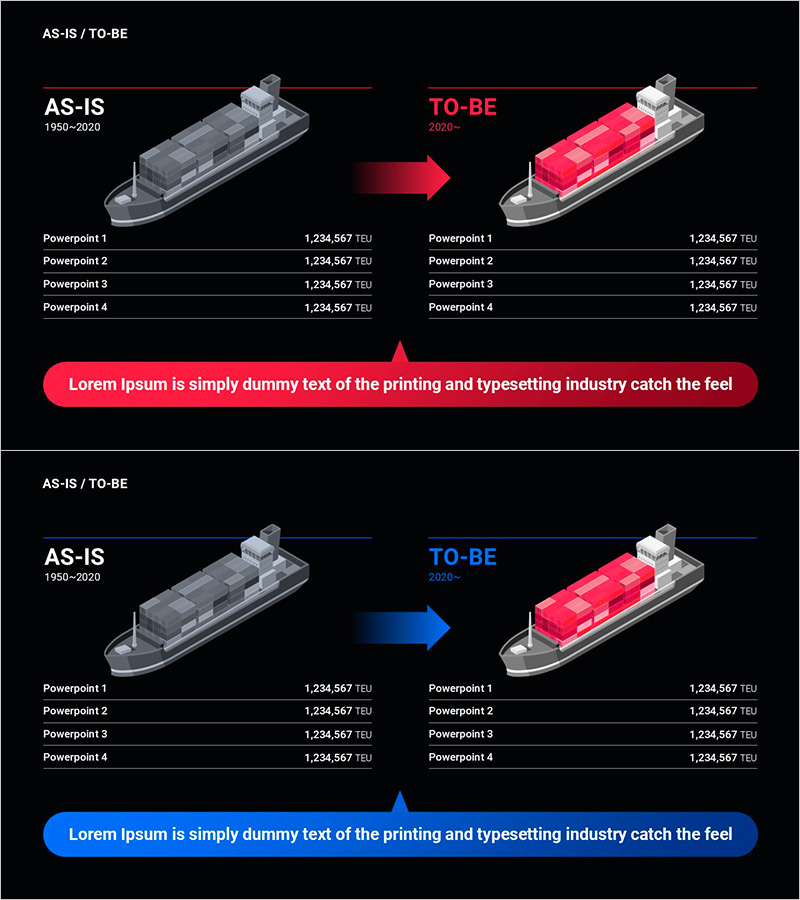
A PowerPoint slide designed to visually compare current shipping and logistics operations with future improvement goals. The slide features a black background with a two-column layout: AS-IS (current state, 1950–2020) on the left and TO-BE (target state, 2020 onwards) on the right. 3D ship imagery, directional arrows, and data tables clearly communicate logistics optimization strategies. The 4-slide set includes multiple color variations (red and blue accents) for flexible presentation scenarios. Ideal for executive briefings, investor pitches, operational planning, and strategic improvement proposals in the maritime and logistics industry.
Usage Points
-
Main Usage
Effectively communicates the current state and improvement objectives of logistics operations to executives and investors, establishing credibility for strategic initiatives. The combination of ship imagery and quantitative data provides a compelling visual argument for operational transformation in the maritime sector.
-
How to Use
Suitable for business strategy presentations, executive reports, investor relations meetings, and internal improvement initiative briefings. Simply populate the AS-IS section with current performance metrics and the TO-BE section with target objectives to create a ready-to-present slide deck.
-
Recommended For
Shipping and logistics professionals, C-suite executives, business development teams, management consultants, and investor relations specialists presenting operational improvements, business plans, and performance reports. Particularly valuable for logistics optimization and operational efficiency project presentations.
-
Slide Structure
Four-slide set with consistent two-column comparative layout. Each slide displays AS-IS (1950–2020 current operations) on the left and TO-BE (2020 onwards target state) on the right. Elements include 3D ship imagery, four-row data table (Powerpoint 1–4), central directional arrow, and bottom descriptive text box, creating clear information hierarchy.
Related Products
-

PowerPoint Template for Service Operation Strategy Presentation
#Business Management #Operational Plan #Technical Approach
-

Coffee Speaking Box – Capturing Business Strategy
#Business Strategy #Operational Plan #Diagram
-

Modern Color Presentation Template – Design Inspiration
#Business Vision and Strategy #Operational Plan #Text Box
-

Circle Puzzle Connected Diagram for Operational Planning – Efficient Service Execution
#Operational Plan #Technical Approach #Diagram
