Business Promotion Strategy
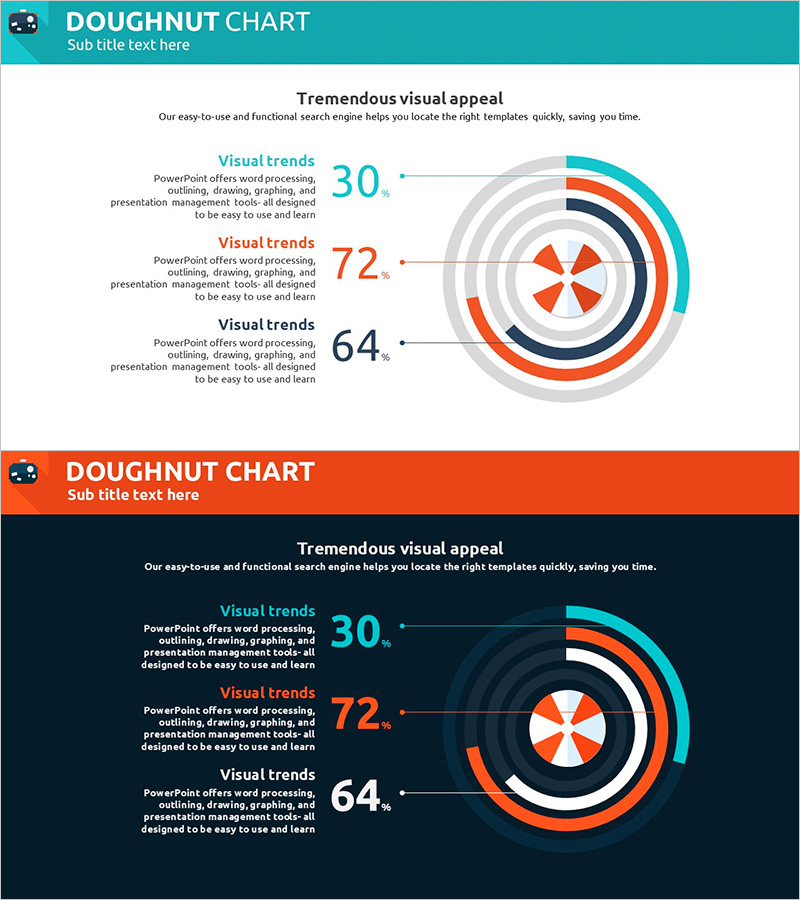
Visualizing Business Performance with Tube Donut Chart – Strategies for Competitive Advantage
RJ0600080_24
- Last Update 12/21/2025
- File Size 0.2MB
- # of Slides 2
- File Format PPTX
- Slide Ratio 16:9
- Color
Keywords
About the Product
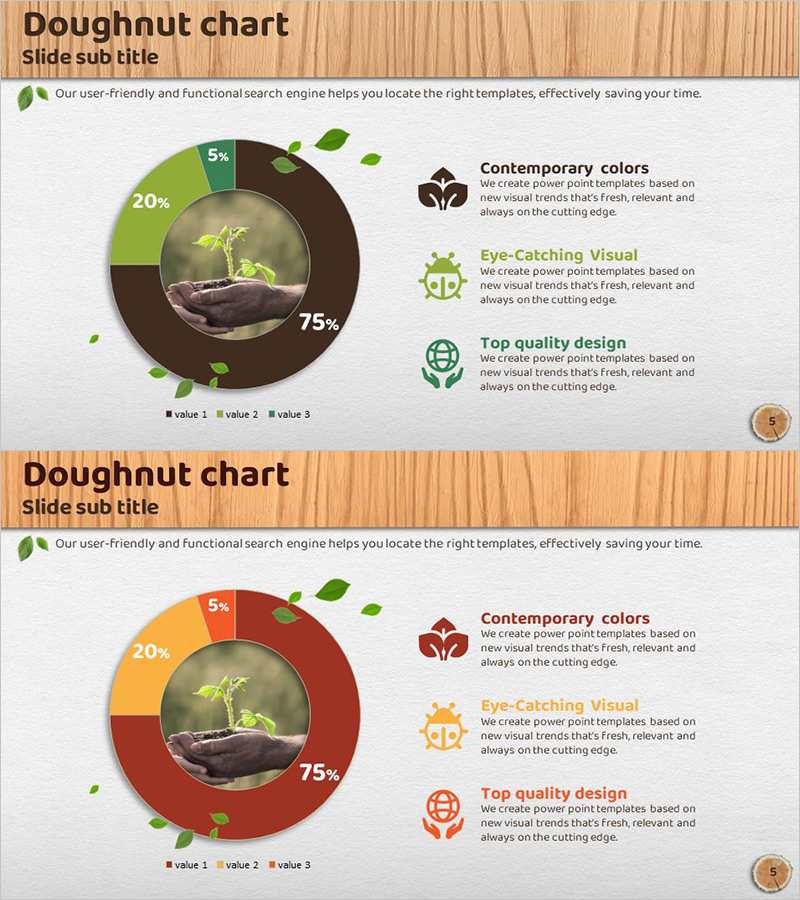
This slide employs a Tube Donut Chart to effectively visualize business performance. The elegant design and striking red and turquoise color scheme emphasize the key messages prominently. It is ideal for business strategy presentations such as competitive analysis and performance comparison. Particularly effective in highlighting competitive advantages. Text and graphs can be easily changed, with an editing difficulty rated as 'easy', enabling swift application in various presentations.
Related Products
-
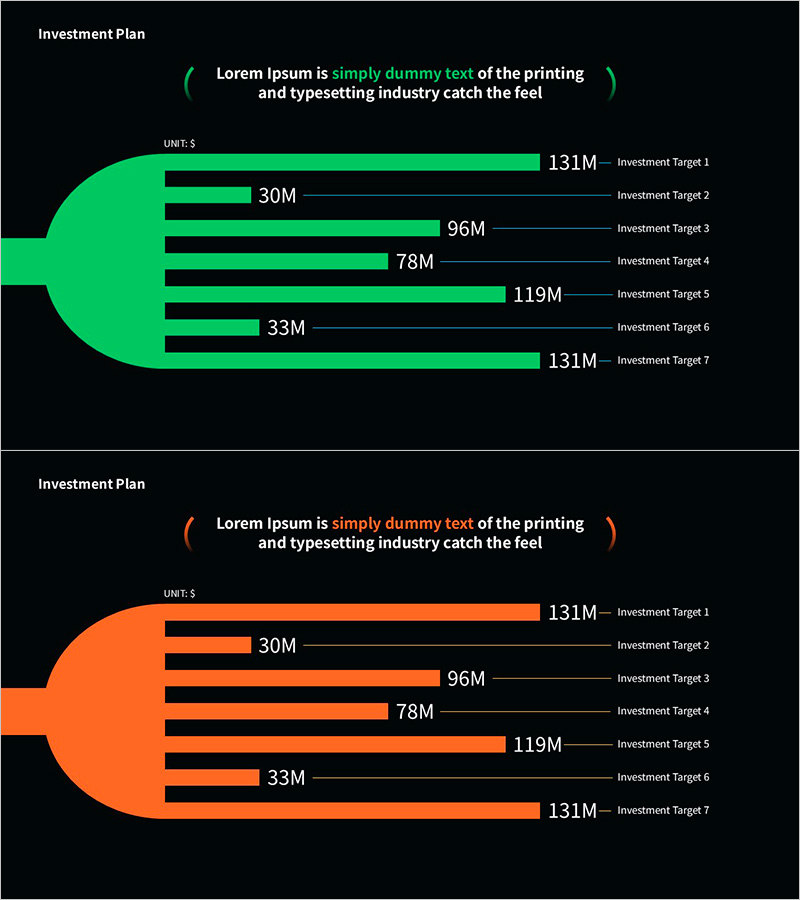
Graph Slide Visualizing Investment Plan
#Financial Plans and Performance #Graph #Capital Requirement Plan
-
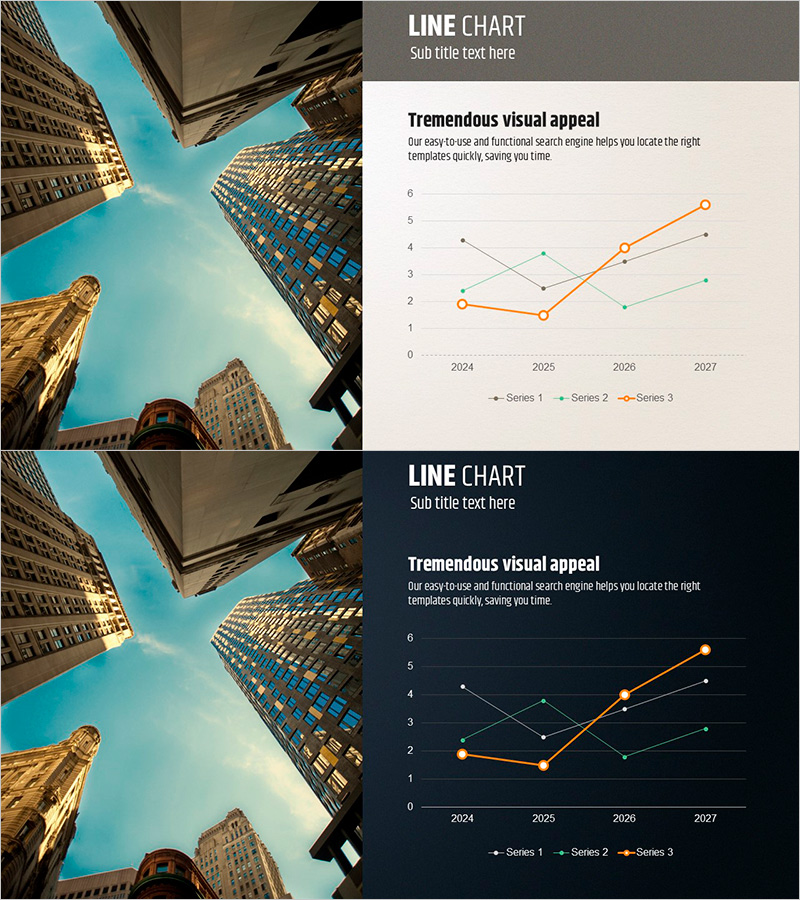
Sales Trend by Division – Performance Insights
#Market and Competitor Analysis #Financial Plans and Performance #Graph
-
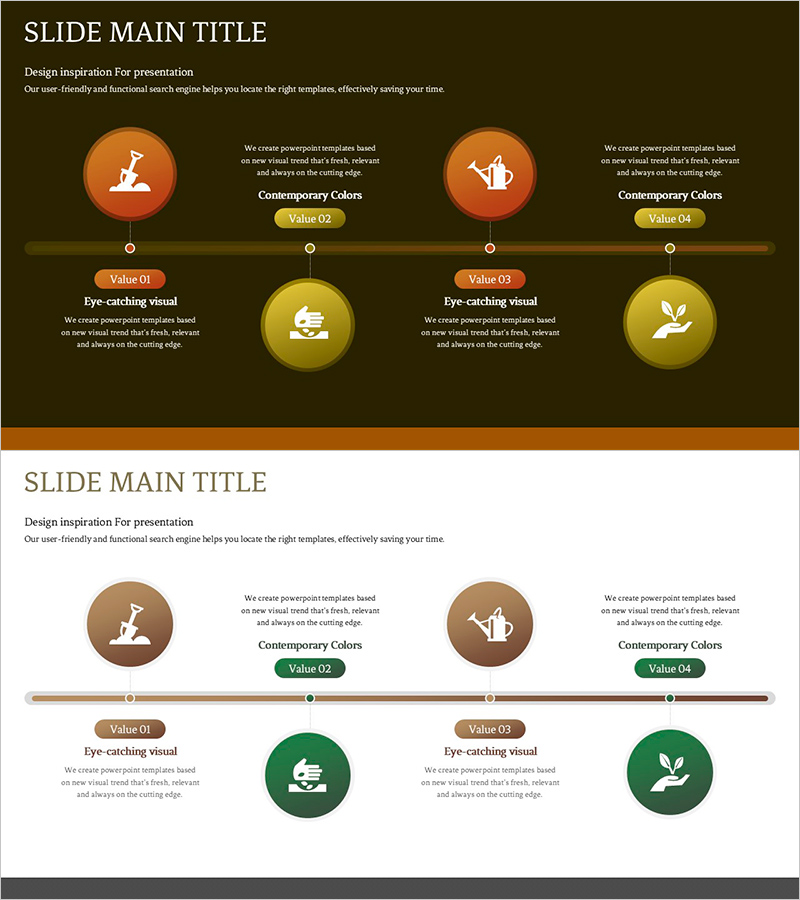
Gardening Process Diagram – Eco-Friendly Operational Strategy
#Business Promotion Strategy #Operation Plan #Diagram
-
Market Share Donut Chart for Eco-Friendly Businesses – Trends and Insights
#Market and Competitor Analysis #Graph #Market Share
