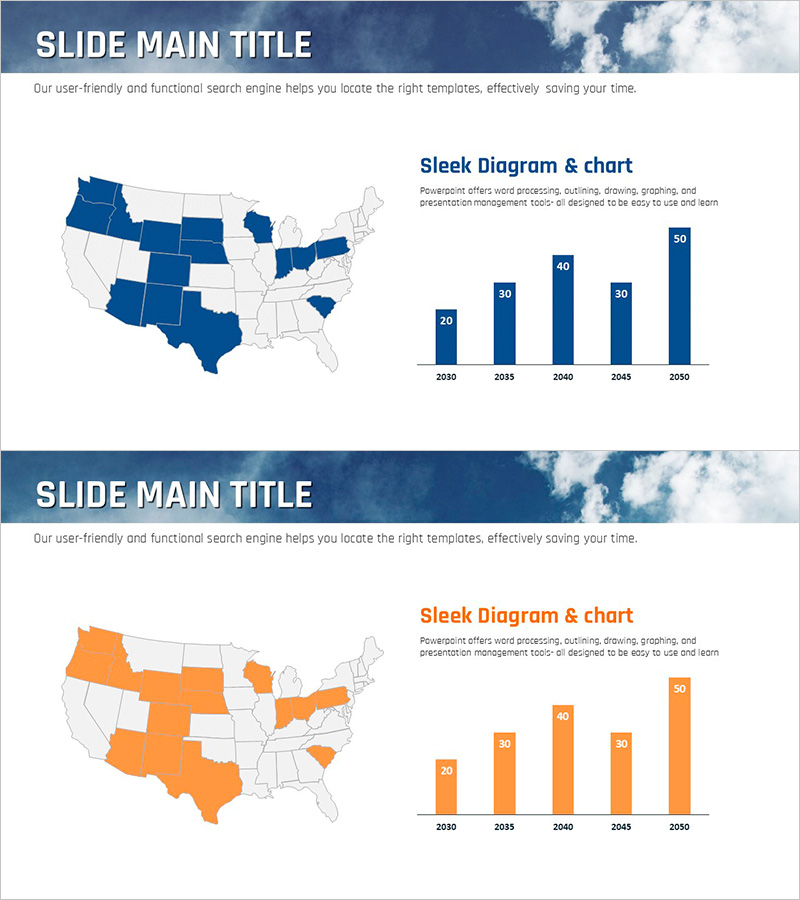
Market and Competitor Analysis
Vertical Bar Graph for U.S. Market Analysis by Region – Sea Lighthouse
RJ0600079_24
- Last Update 12/21/2025
- File Size 3MB
- # of Slides 2
- File Format PPTX
- Slide Ratio 16:9
- Color
Keywords
About the Product
This slide effectively visualizes the market analysis of the U.S. by region using a vertical bar graph. The sophisticated blue and green colors provide a sense of stability, while the clean design facilitates easy data comparison. It is ideal for understanding market conditions and target markets, making it suitable for investment proposals or business strategy documents. This slide is perfect for users looking to highlight critical data or statistical figures.
Related Products
-
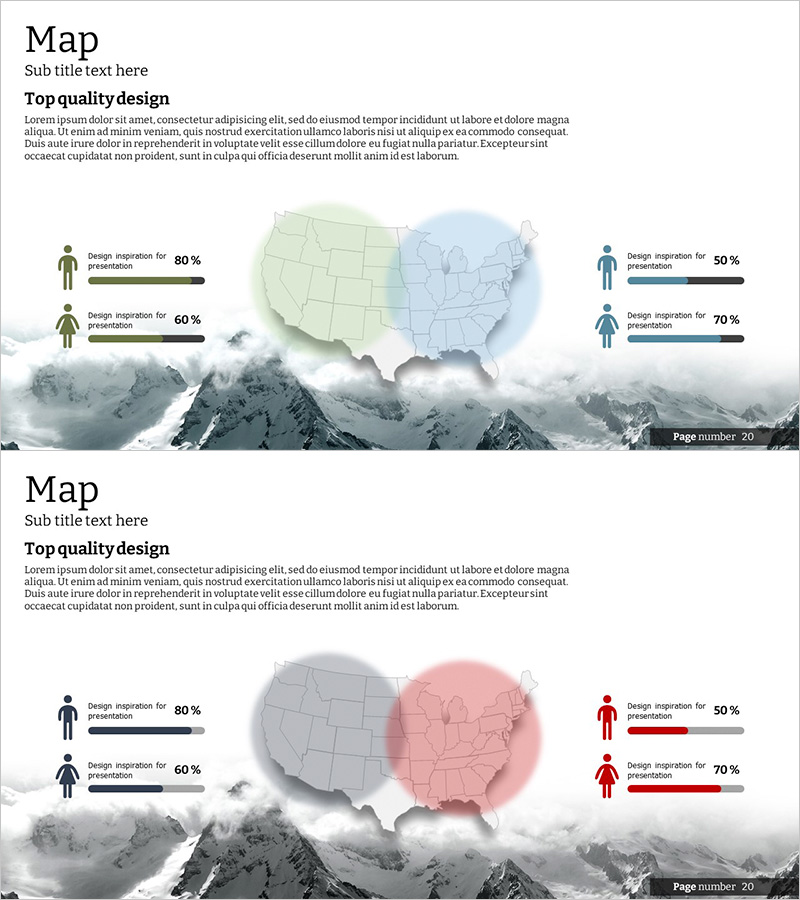
Analysis of the Gender Ratio of Users in the US Market – A Blend of Teal and Gray
#Market and Competitor Analysis #Graph #Other
-
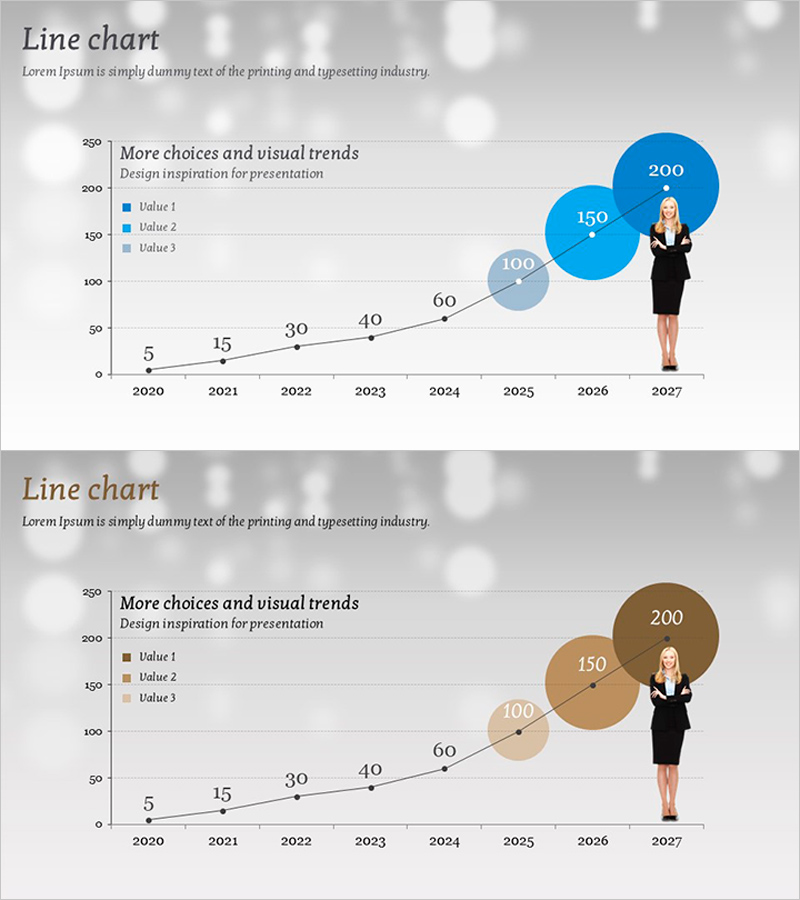
Estimated Sales Revenue Graph – Visualizing Business Performance
#Business Promotion Strategy #Financial Plans and Performance #Graph
-
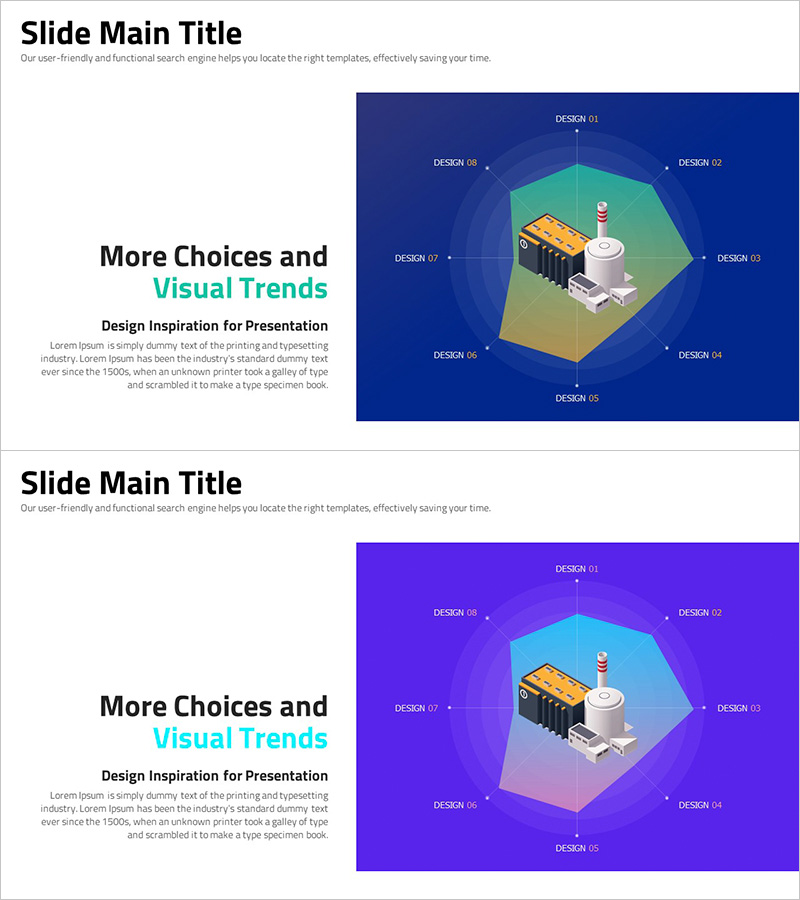
More Choices in Visual Trends for Effective Presentation Design
#Product/Service #Business Introduction #Graph
-

Wedding Dress Types – Understanding the Market through Customer Analysis
#Product/Service #Market and Competitor Analysis #Product/Service Introduction
