Market and Competitor Analysis
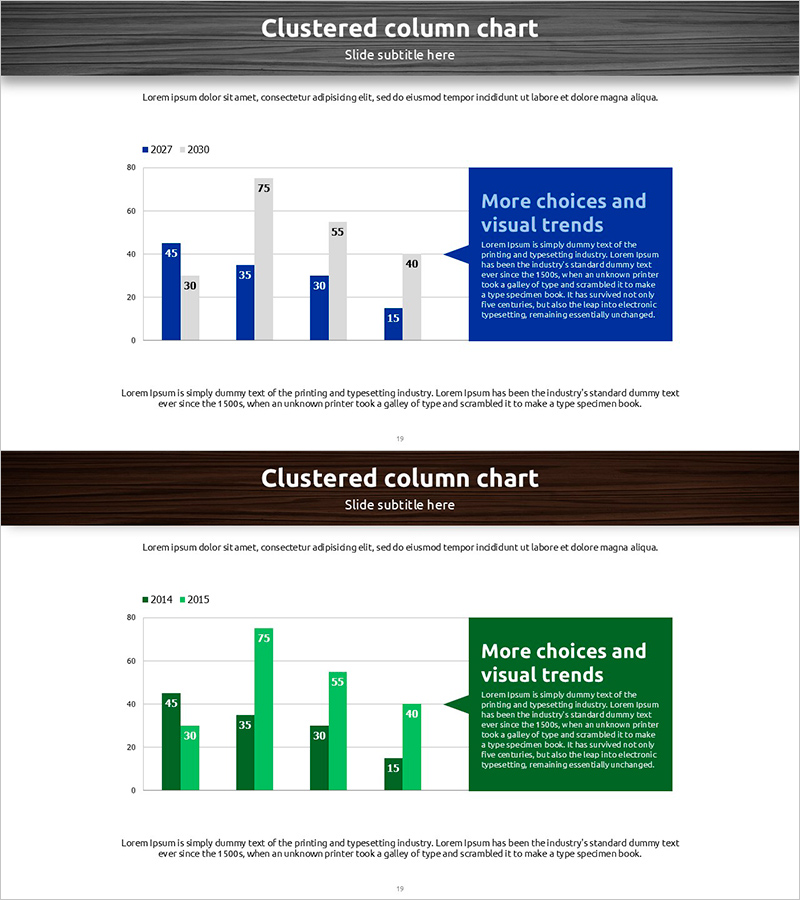
Sales Status Table and Analysis – Clustered Column Charts for Competitor Analysis
RJ0600077_18
- Last Update 12/21/2025
- File Size 6.2MB
- # of Slides 2
- File Format PPTX
- Slide Ratio 16:9
- Color
Keywords
About the Product
This slide showcases sales status using clustered bar charts and vertical bar graphs. It offers a clear comparison of competitive data relevant to specific years, making it indispensable for market and competitor analysis. The combination of blue and green colors conveys trust and professionalism, featuring a layout that distinctly separates the title from the data section. This slide is particularly suitable for developing sales strategies and understanding market dynamics. Text and data replacements are straightforward, with an editing difficulty rated as 'easy'.
Related Products
-
Competitor Analysis Bar Graph – Visualizing Market Competitive Advantages
#Market and Competitor Analysis #Graph #Competitor Analysis
-
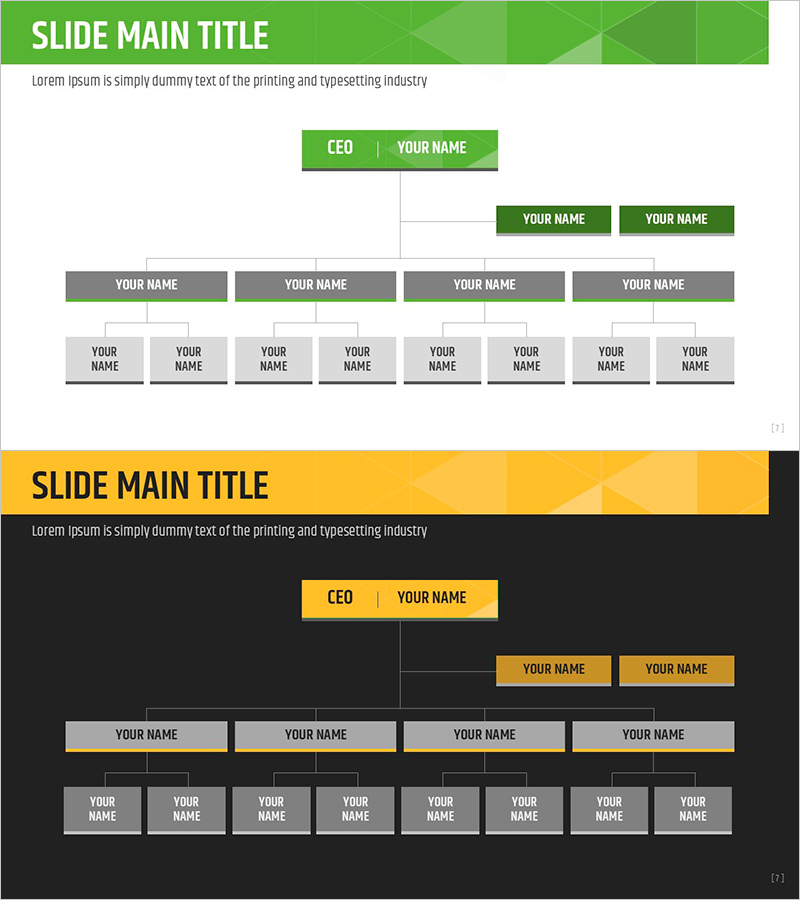
Green Yellow Organization Chart Slide - Company Introduction
#Company Introduction #Graph #Organizational Chart
-
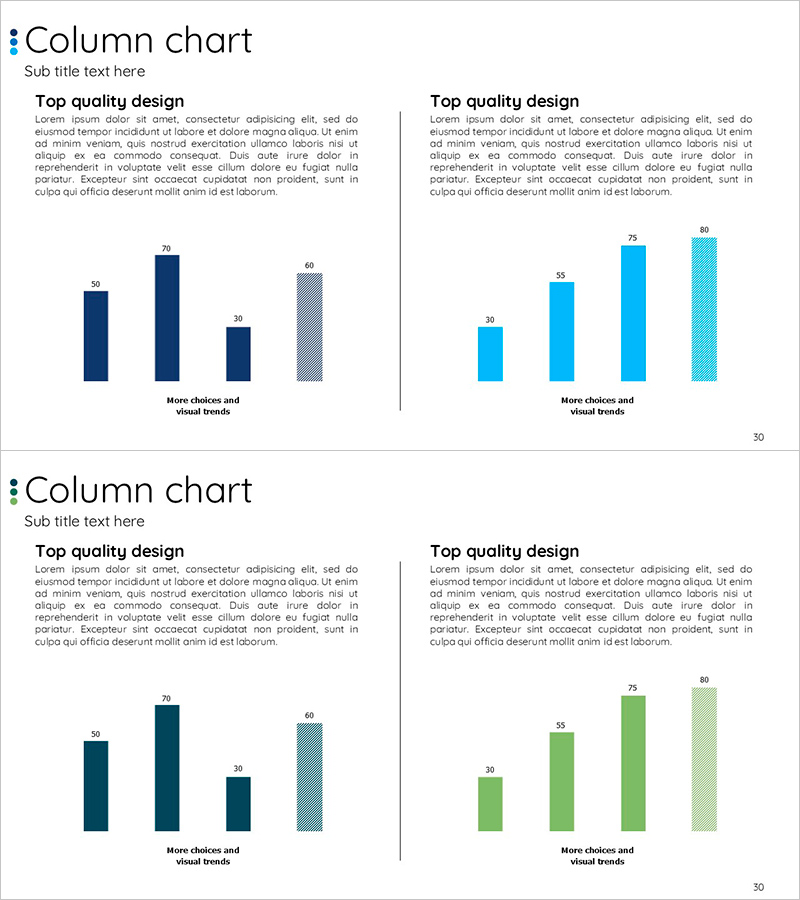
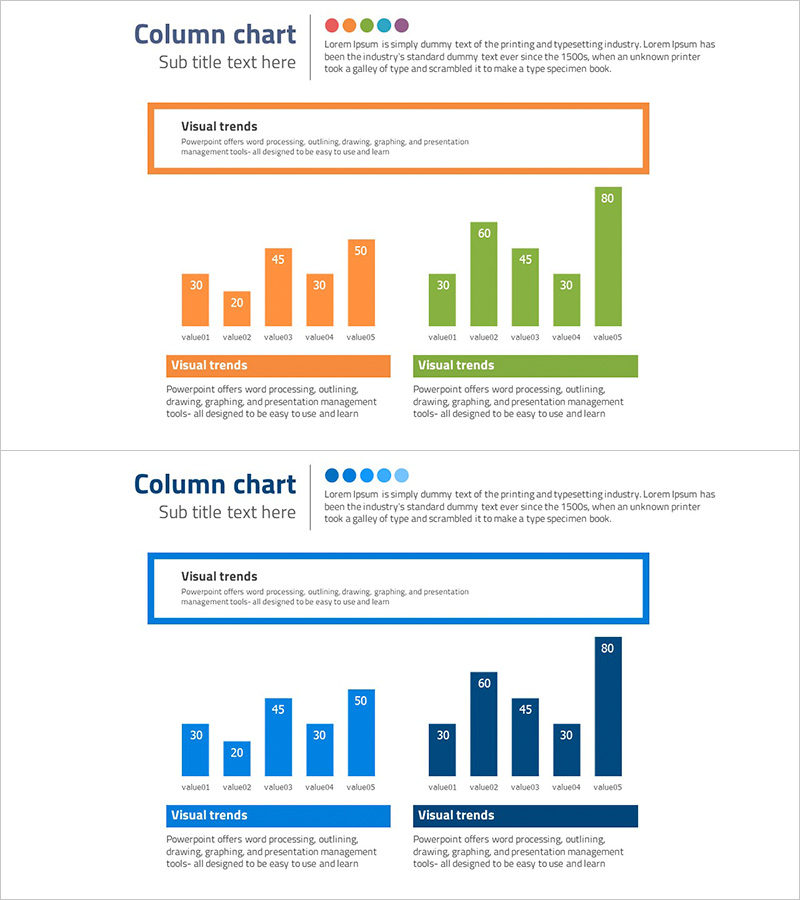
Column Chart for Comparative Analysis – Market and Competitive Advantage
#Market and Competitor Analysis #Graph #Market Analysis
-
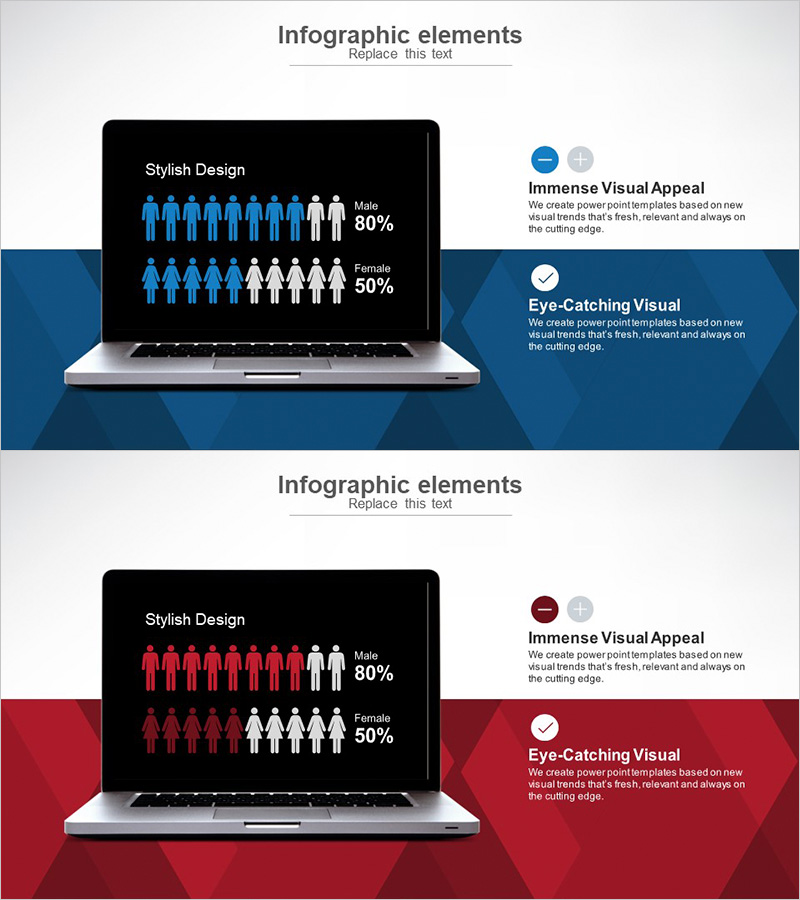
User Gender Ratio Analysis Graph – Essential Tool for Market and Customer Analysis
#Market and Competitor Analysis #Graph #Other
