Business Promotion Strategy
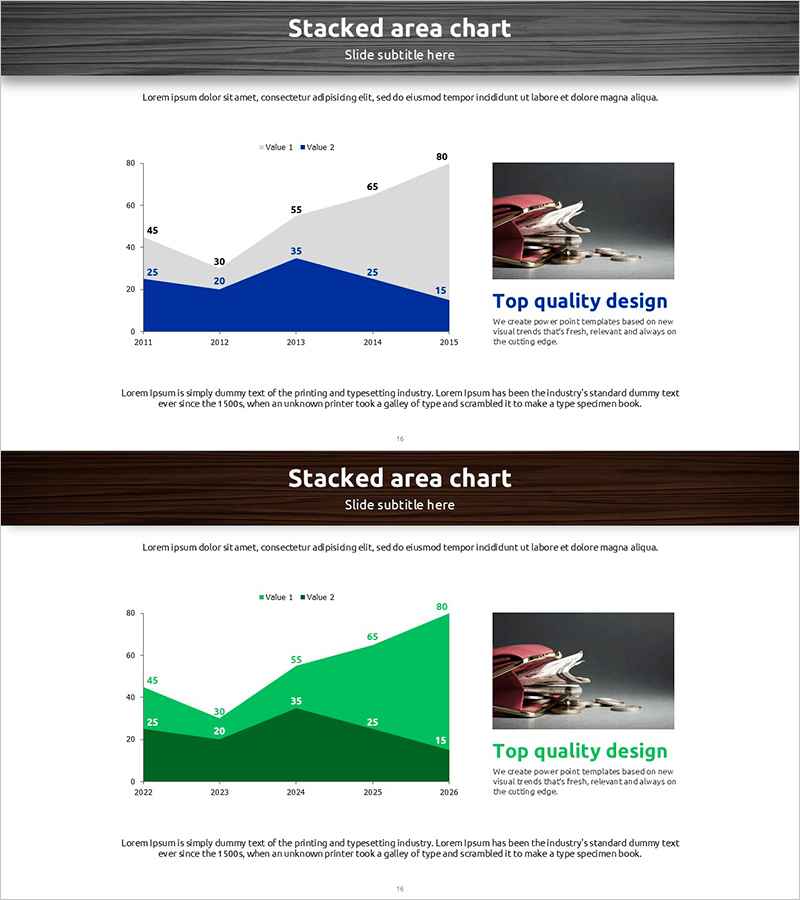
Analyzing Bank Delinquency Rate Trends with Stacked Area Chart
RJ0600077_15
- Last Update 12/21/2025
- File Size 6.5MB
- # of Slides 2
- File Format PPTX
- Slide Ratio 16:9
- Color
Keywords
About the Product
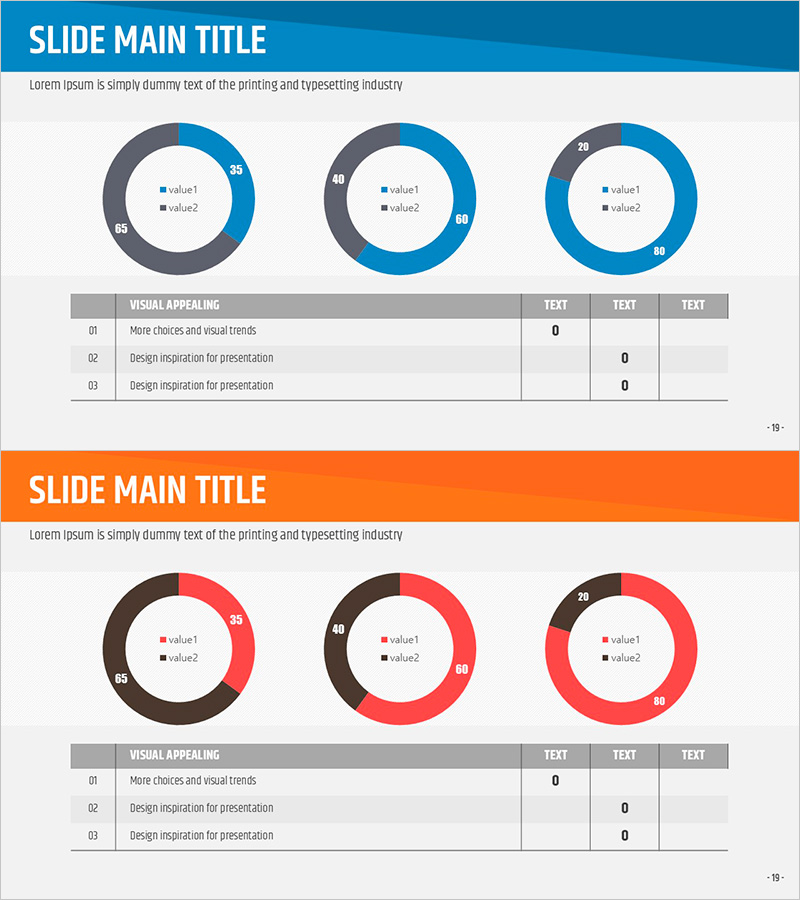
This PowerPoint slide visually presents the trends of bank delinquency rates using a stacked area chart. The design features blue and green colors that emphasize credibility and stability for data analysis, making it suitable for business reports or academic presentations. It illustrates data from 2011 to 2026, allowing for the identification of significant changes or patterns. This slide is editable for text and graphs, suitable for various presentation materials, and has a moderate editing difficulty level.
Related Products
-
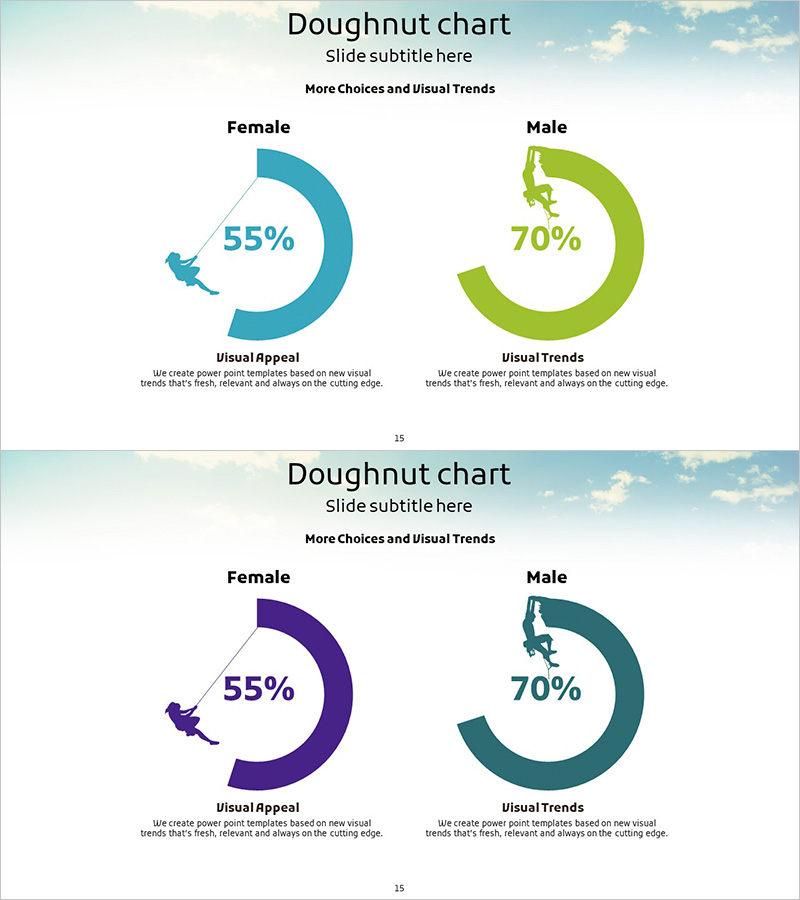
Mountain Climbing Customer Evaluation and Feedback Donut Chart
#Market and Competitor Analysis #Customer Success Stories #Graph
-
Comparison of Temperature Differences by Weather - Business Vision and Strategy
#Business Vision and Strategy #Business Promotion Strategy #Business Background and Necessity
-
Analysis of Brand Logos by Competitors – Market Insights and Visual Data
#Market and Competitor Analysis #Financial Plans and Performance #Diagram
-
Market Analysis Slide Using Donut Charts and Table
#Market and Competitor Analysis #Diagram #Graph
