Market and Competitor Analysis
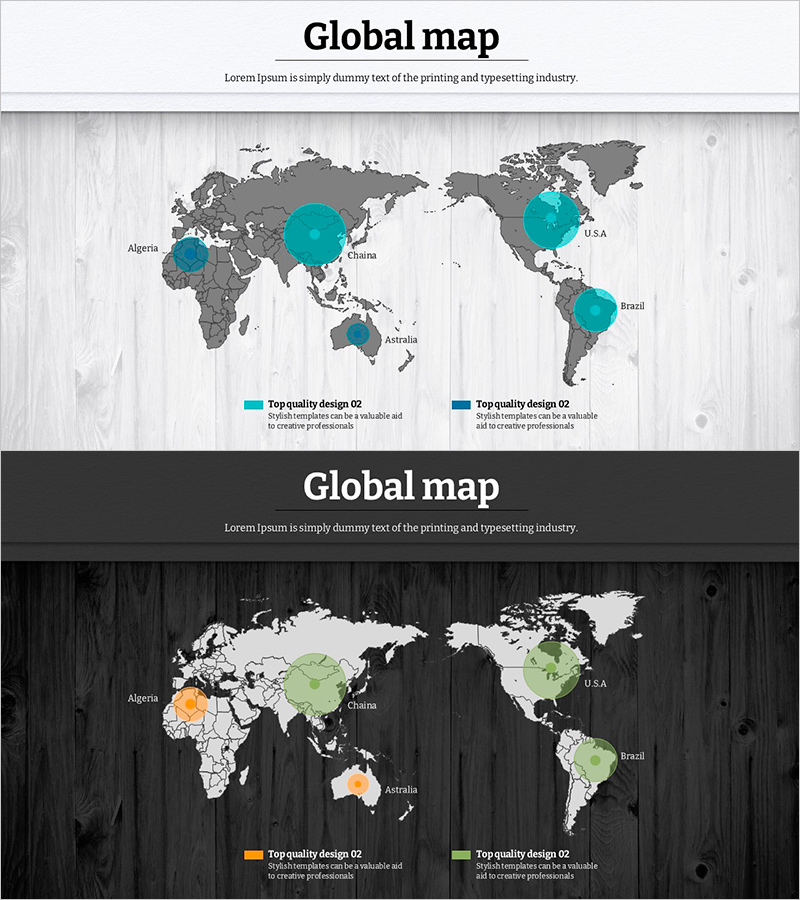
Global Map and Distribution Chart – Insights for Market Understanding
RJ0600068_17
- Last Update 12/21/2025
- File Size 4.7MB
- # of Slides 2
- File Format PPTX
- Slide Ratio 16:9
- Color
Keywords
About the Product
This slide features a global map and distribution chart that visually presents market analysis information. Using teal and green colors, it intuitively represents the distribution across various markets, with clearly marked data points for each region. It is ideal for analyzing market trends, characteristics of target regions, and strategic planning. This slide is commonly used in investor meetings, business reports, or market entry strategy presentations. Elements such as text and visualized data are easy to replace, with an editing difficulty rated as 'easy', allowing for quick adaption to various presentations.
Related Products
-
Geometry PPT Template Wide Horizontal Bar Segmentation Graph
#Market and Competitor Analysis #Graph #Industry Trends
-

Cluster Diagram Slide for Weakness Analysis
#Market and Competitor Analysis #Diagram #SWOT Analysis
-

Bar Graph for Surveying Life Satisfaction by Environment
#Market and Competitor Analysis #Graph #Market Analysis
-
Visualizing Internet of Things Market Trends with Bar Chart
#Market and Competitor Analysis #Graph #Market Analysis
