Graph
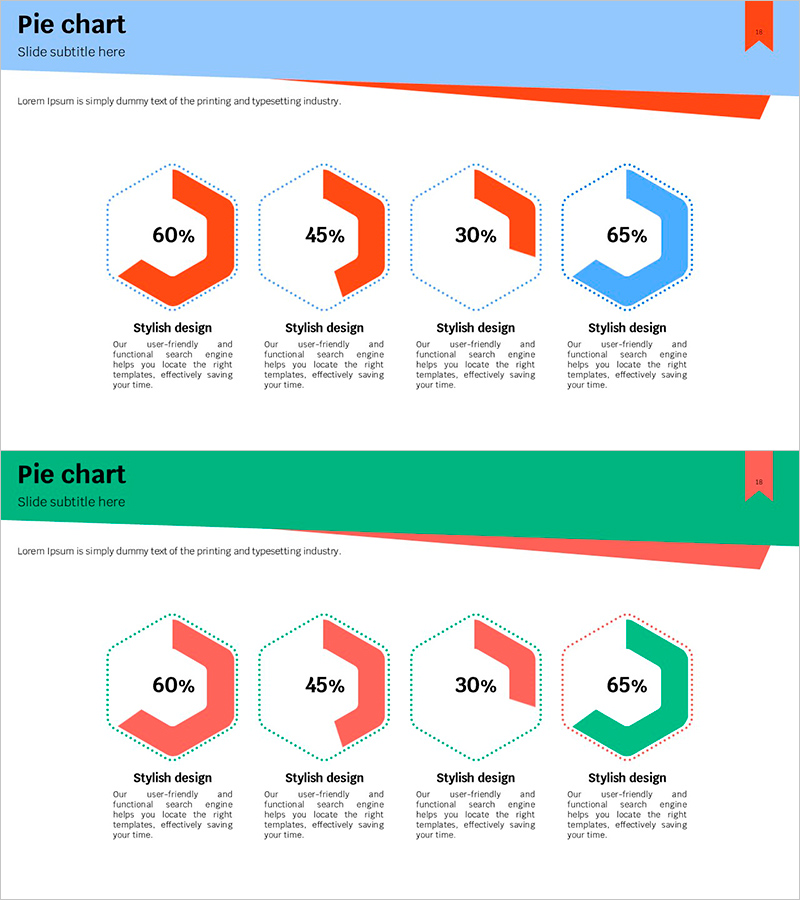
Hexagonal Donut Chart – A Revolution in Data Visualization
RJ0600067_17
- Last Update 12/21/2025
- File Size 0.2MB
- # of Slides 2
- File Format PPTX
- Slide Ratio 16:9
- Color
About the Product
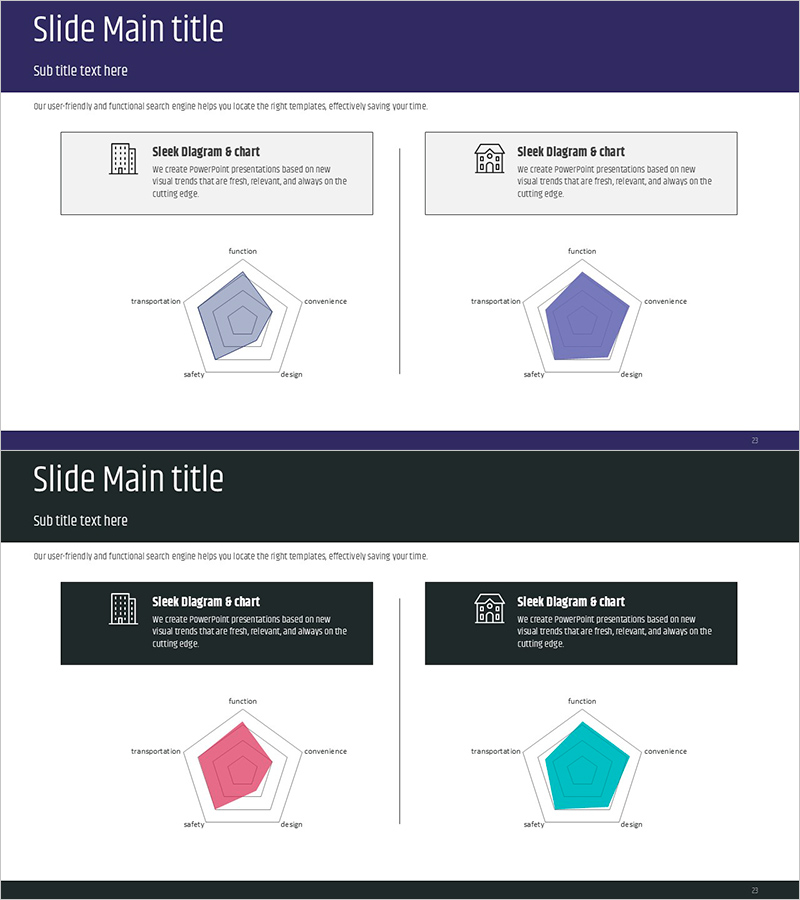
This slide utilizes a hexagonal donut chart to visually convey data effectively. The vibrant blue, green, and red colors create a stylish impression, with a user-friendly structure. This design is perfect for communicating significant data points in strategic business plans, marketing materials, or investor presentations. The target users are corporate professionals and experts preparing presentations, enhancing visual impact through this design. The slide is rated 'easy' in editing difficulty, allowing for simple text and number replacements to be applied quickly.
Related Products
-
Auto Industry Roadmap – Visualizing Business Strategy
#Business Vision and Strategy #Business Promotion Strategy #Diagram
-
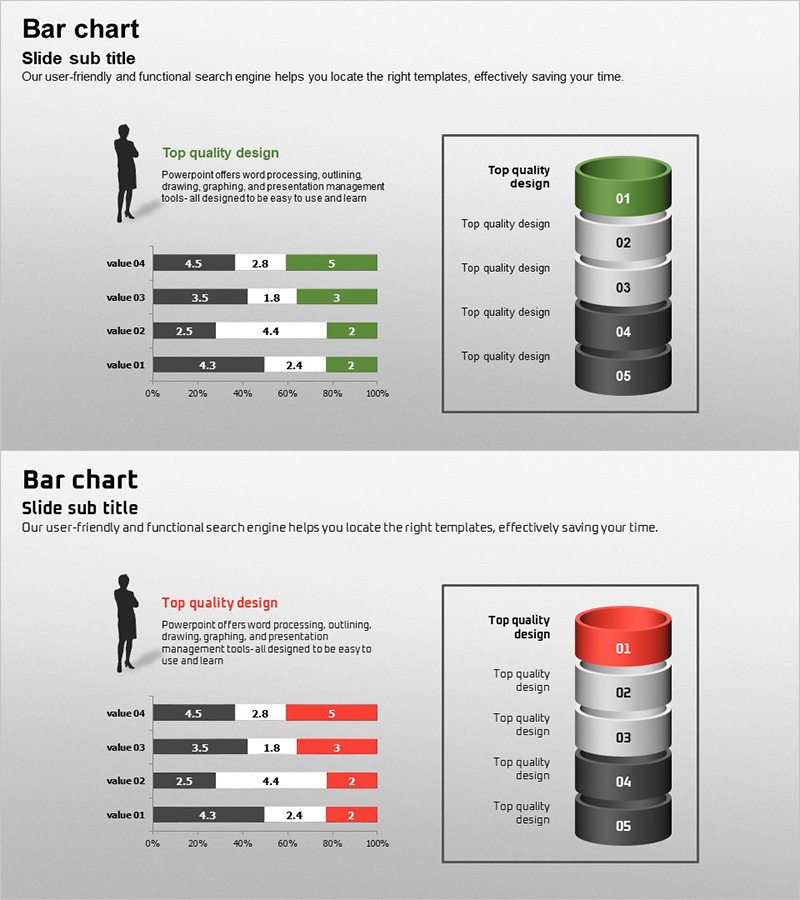
Customer Analysis Segmentation Bar Graph – Foundations of Market Analysis
#Market and Competitor Analysis #Graph #Market Analysis
-
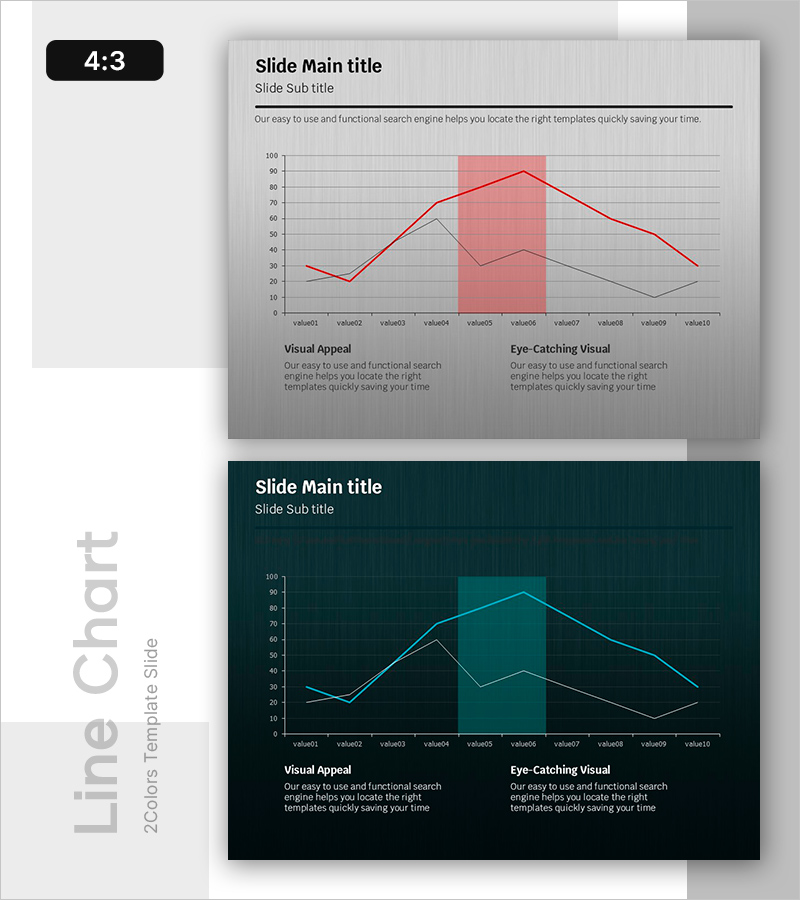
Critical Points in the Growth Curve – Analyzed by Data
#Graph
-
Characteristics and Differences of the Two Buildings – Innovative Design Diagram
#Product/Service #Graph #Features
