Market and Competitor Analysis
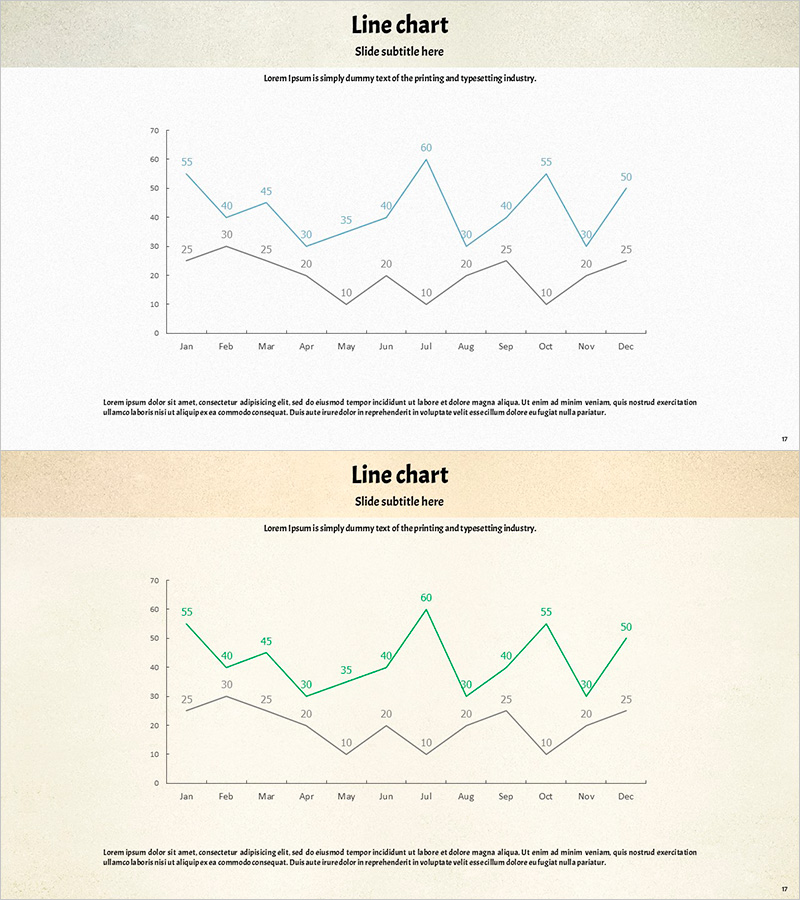
Dynamic Line Graph – Market and Competitor Analysis
RJ0600066_16
- Last Update 12/21/2025
- File Size 8.5MB
- # of Slides 2
- File Format PPTX
- Slide Ratio 16:9
- Color
Keywords
About the Product
This slide utilizes a dynamic line graph to efficiently visualize market status and competitive advantages. The harmony of the two colors ensures clear information delivery while providing intuitive data to the user. The text and graph structure are well-adjusted for convenient editing, making it suitable for market reports, business proposals, or presentations. Featuring teal and green colors, this design conveys trust and vitality. The editing difficulty is rated as 'easy', allowing for quick integration into various reports.
Related Products
-

Sales and Net Income Graph – Visualizing Business Performance
#Market and Competitor Analysis #Financial Plans and Performance #Graph
-

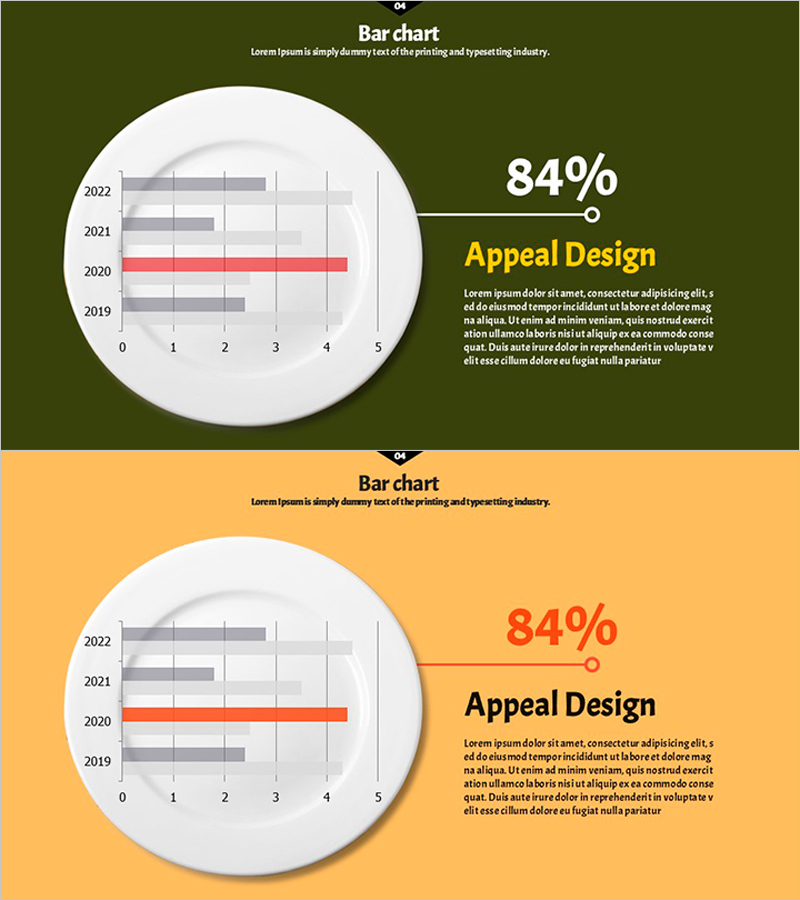
Horizontal Bar Chart Slide Visualizing Airplane Passenger Trends
#Business Promotion Strategy #Graph #Achievements
-
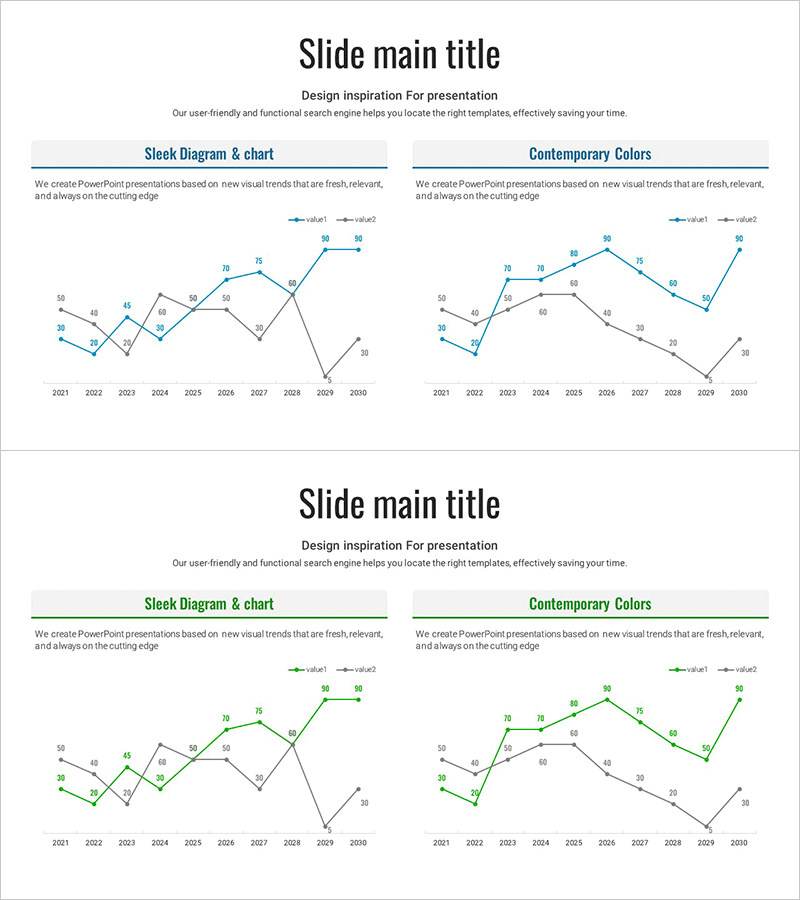
Blue Green Broken Line Graph – Competitor Analysis
#Market and Competitor Analysis #Graph #Competitor Analysis
-
Highlight Graph and Analytical Text – Emphasizing Results and Competitive Advantage
#Company Introduction #Market and Competitor Analysis #Graph
