Financial Plans and Performance
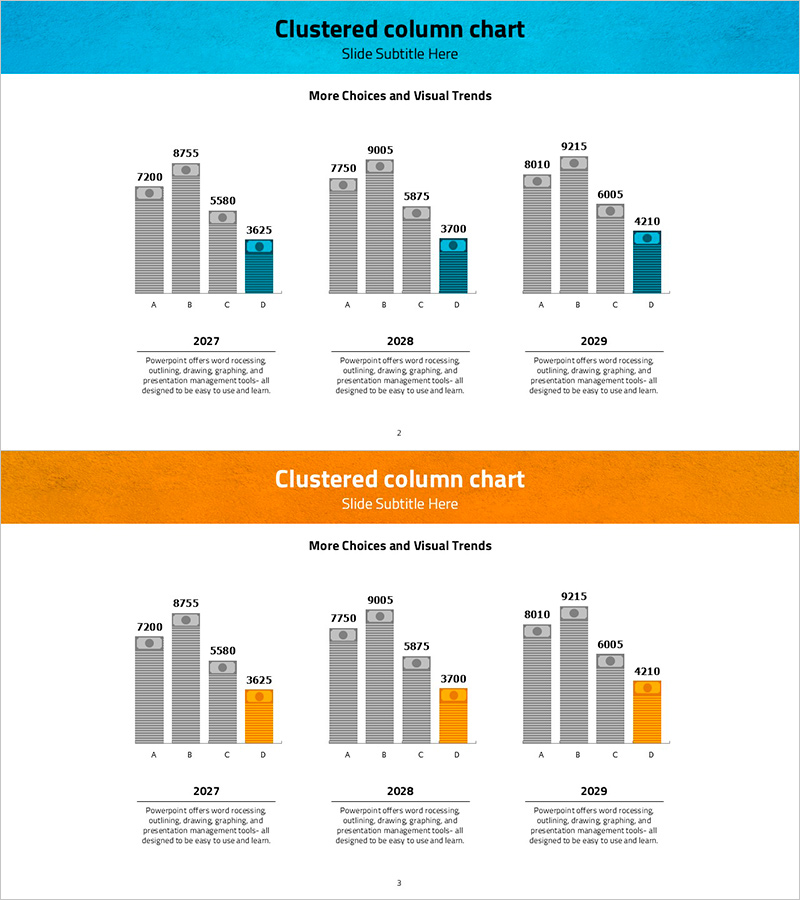
Reconstruction Cost Bar Graph – Financial Planning and Budget
RJ0600044_18
- Last Update 12/21/2025
- File Size 6.9MB
- # of Slides 2
- File Format PPTX
- Slide Ratio 16:9
- Color
Keywords
About the Product
This slide features a bar graph designed to visually emphasize reconstruction costs. The graph includes both horizontal and vertical bars, making data comparison straightforward, and utilizes blue and orange colors to clearly convey emphasis points. It is suitable for budget management and funding plan presentations, particularly due to the template's clean design that enhances clarity. It will assist users in providing insights in financial reports, proposals, or planning documents. Users can easily replace text and data fields, with an editing difficulty rated as 'easy' for quick application.
Related Products
-

Cosmetic Ingredient Ratio Chart – Doughnut Slide for Market Analysis
#Business Promotion Strategy #Market and Competitor Analysis #Graph
-
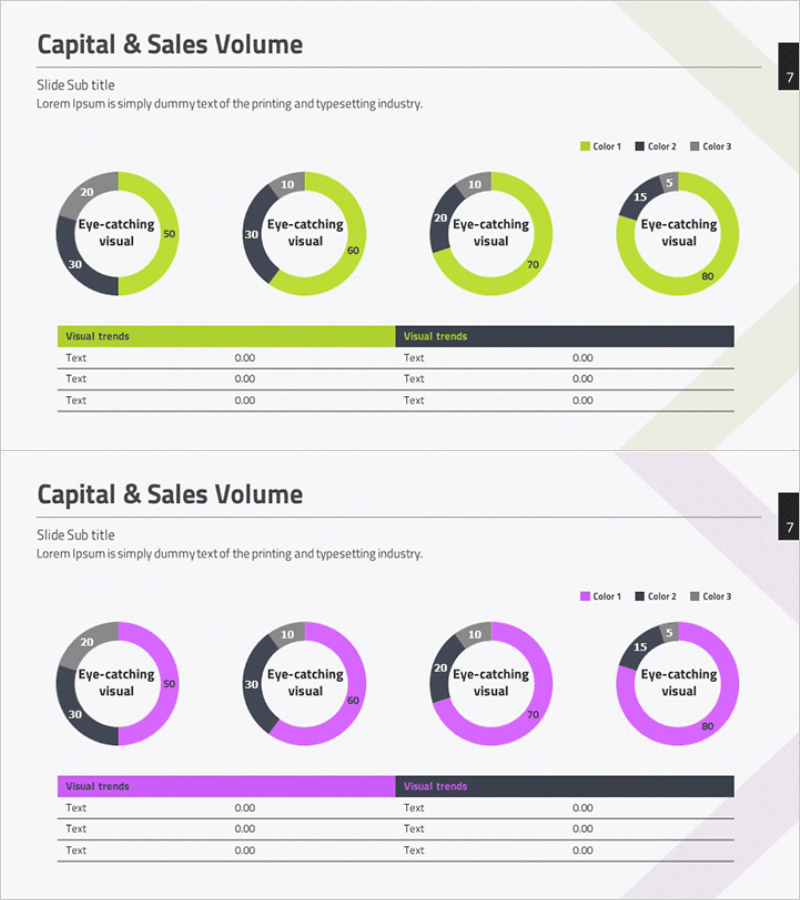
Capital Sales Analysis Graph – Visualizing Financial Performance
#Financial Plans and Performance #Diagram #Graph
-
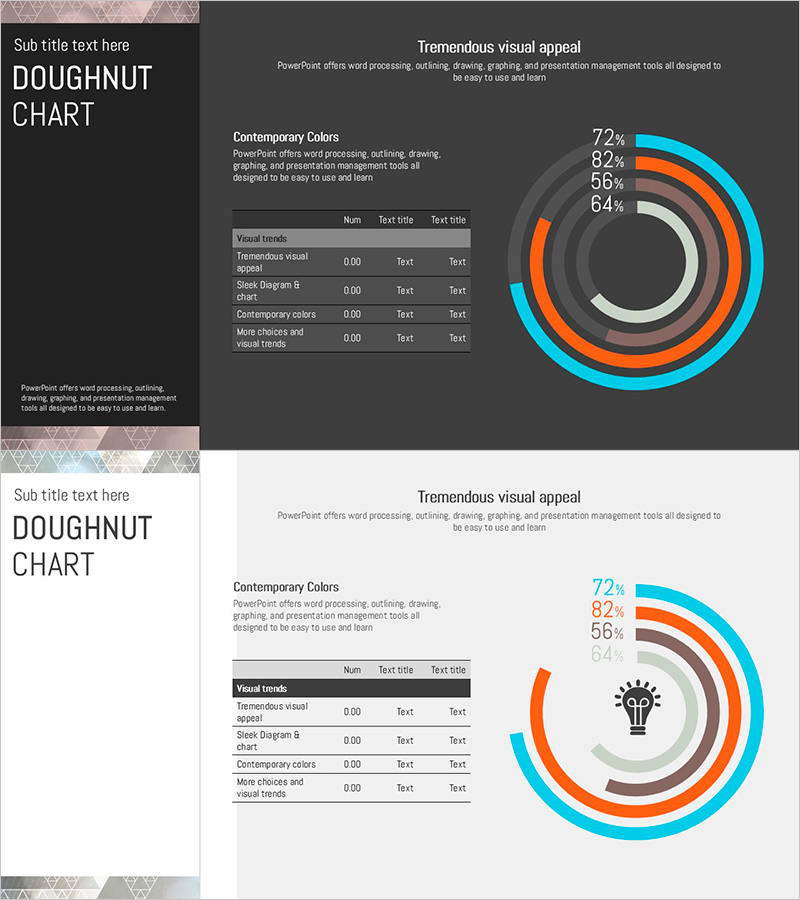
Doughnut Chart for Financial Performance Visualization – Current Technology Status
#Business Introduction #Financial Plans and Performance #Diagram
-
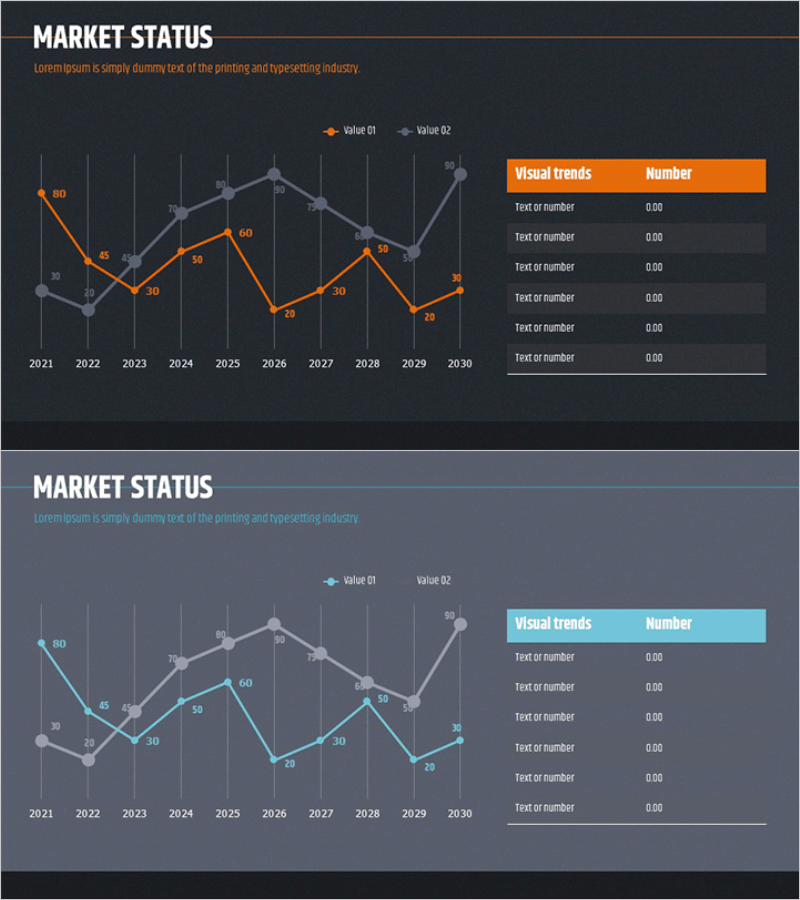
Market Analysis Bar Graph & Table - Data Visualization for Competitive Advantage
#Market and Competitor Analysis #Diagram #Graph
