Financial Plans and Performance
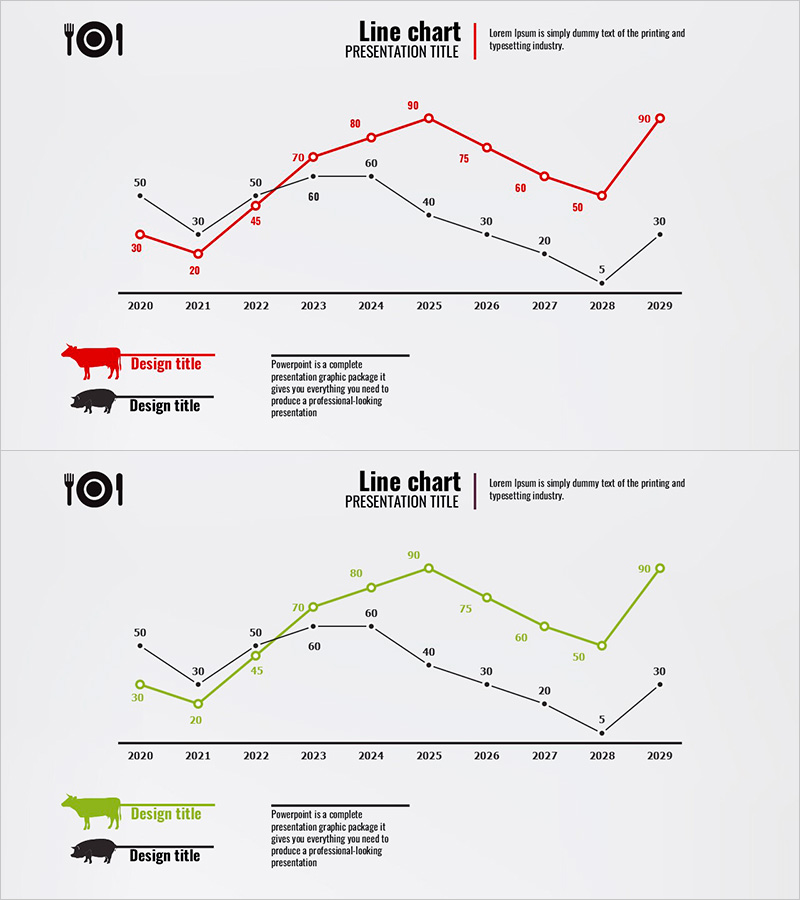
Red Green Basic Line Charts – Visualizing Financial Performance
RJ0600041_15
- Last Update 12/21/2025
- File Size 0.2MB
- # of Slides 2
- File Format PPTX
- Slide Ratio 16:9
- Color
Keywords
About the Product
This slide utilizes a line chart to highlight financial planning and performance metrics. The use of red and green colors distinctly presents significant data changes while visually portraying a consistent growth trend. It is specifically designed to be suitable for comparing expected investment returns. With a separate title area at the top, it conveys a strong message alongside annotations. This can be immediately utilized in various business presentations, particularly beneficial for finance professionals and business discussions. Editable elements include text and data, with an editing difficulty rated as 'easy' for quick modifications.
Related Products
-
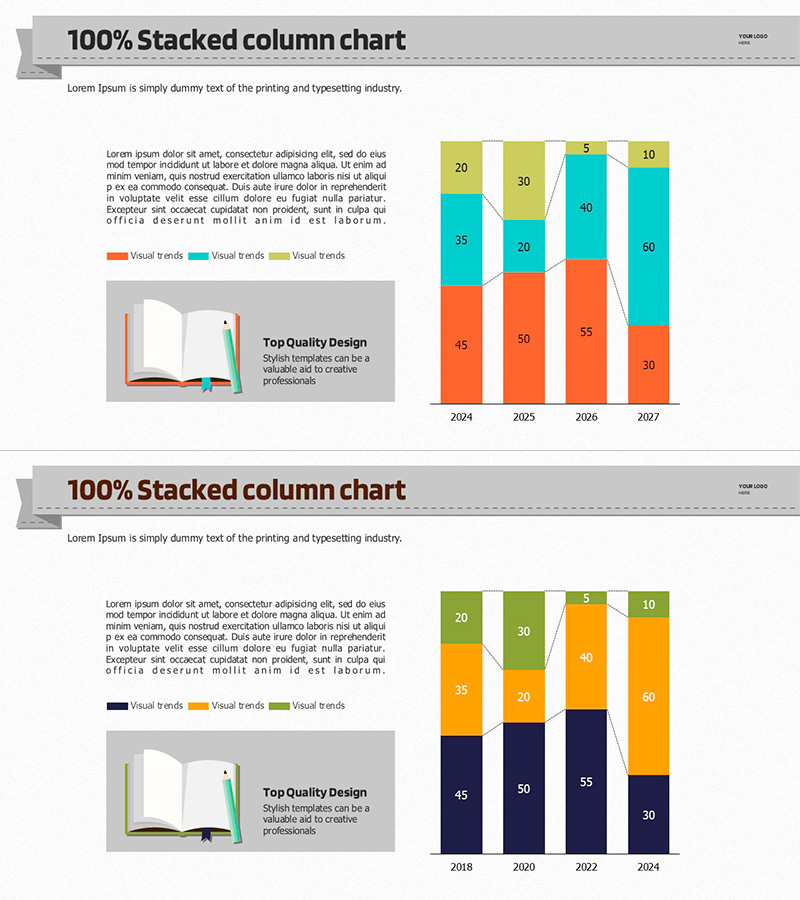
Column Segmentation Graph for Research – Visualization of Market Trends
#Market and Competitor Analysis #Marketing Plan and Strategy #Graph
-
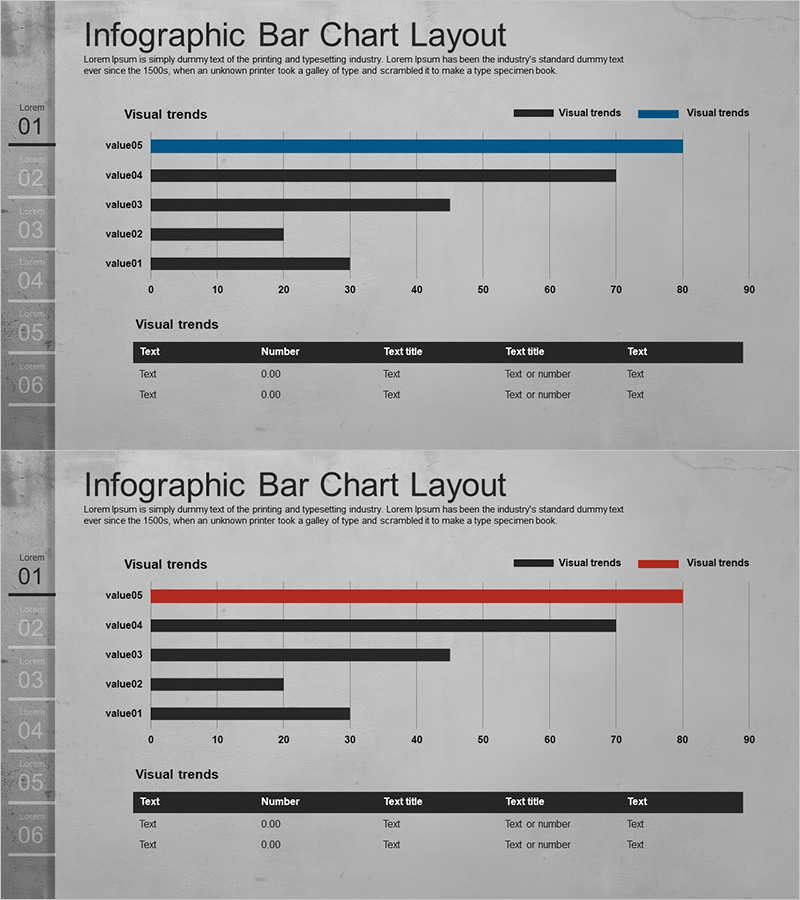
Cement Theme Bar Graph & Table
#Market and Competitor Analysis #Diagram #Graph
-

Analysis of US Target Region Users – In-Depth Visualization
#Market and Competitor Analysis #Marketing Plan and Strategy #Graph
-
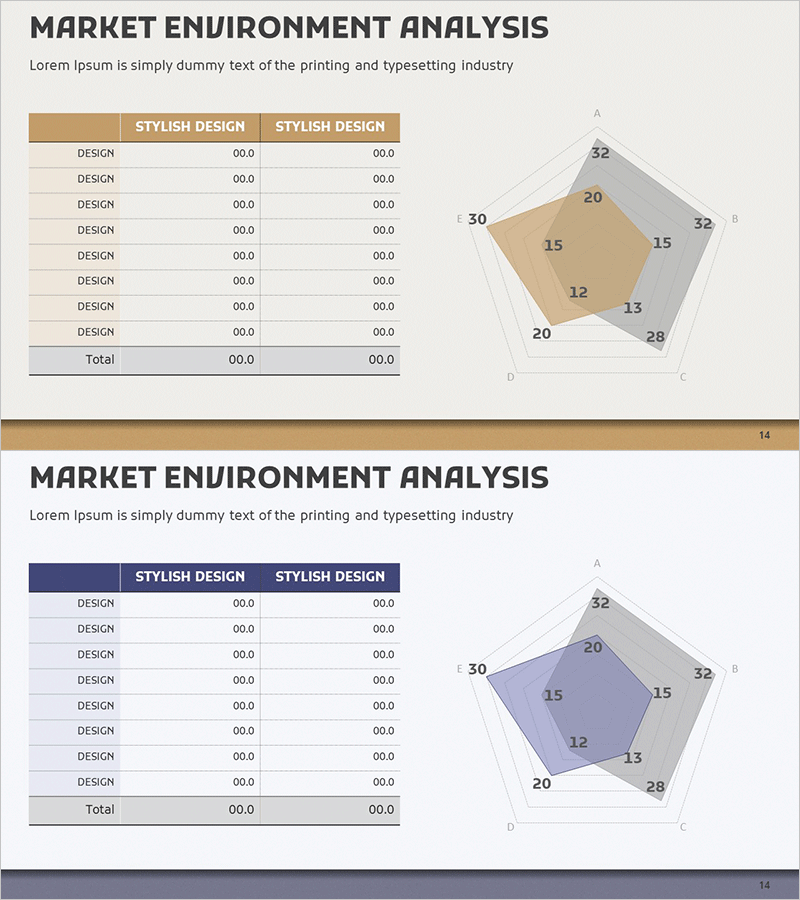
Insights into Market Analysis – Radial Graph
#Diagram #Graph
