Company Introduction
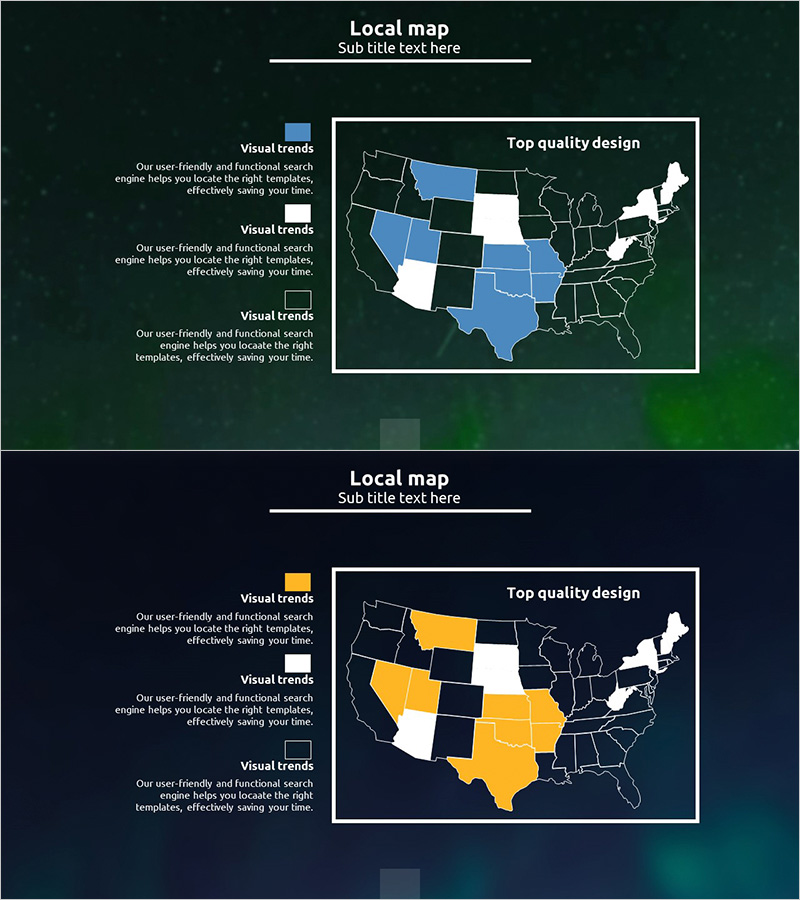
Aurora Analysis by US Region – Visualization for Insights
RJ0600032_6
- Last Update 12/21/2025
- File Size 0.9MB
- # of Slides 2
- File Format PPTX
- Slide Ratio 16:9
- Color
Keywords
About the Product
This slide is designed to visually represent the Aurora analysis by US region. The modern and clean design facilitates understanding of auroras across major cities and regions. The harmonious use of blue, green, and yellow maximizes visual impact. This slide structure intuitively conveys regional data, making it useful in various business contexts such as market analysis, proposals, and reports. It features easy-to-edit text and images, with an editing difficulty rated as 'moderate'. This slide will enhance your presentations with stunning visual representation.
Related Products
-

Introduction of Wave Theme Personnel – The Charm of Flow and Collaboration
#Company Introduction #Market and Competitor Analysis #Diagram
-

Employment Gender Ratio Analysis Slide
#Market and Competitor Analysis #Graph #Other
-
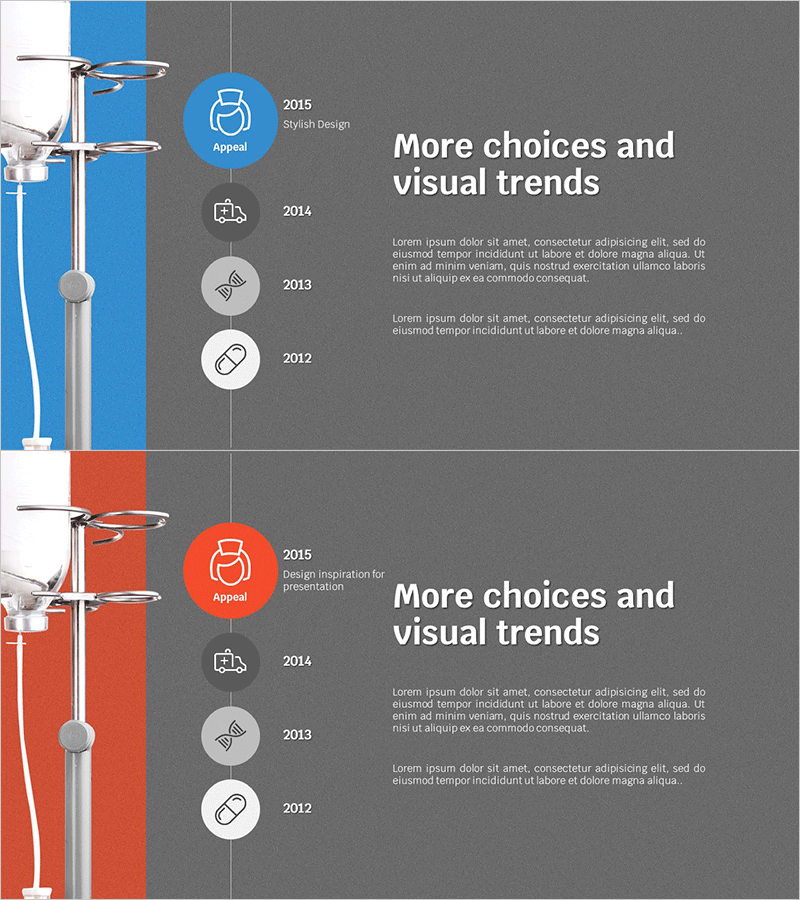
Medical Business History Diagram – Visual Representation of Chronology
#Company Introduction #Diagram #History
-
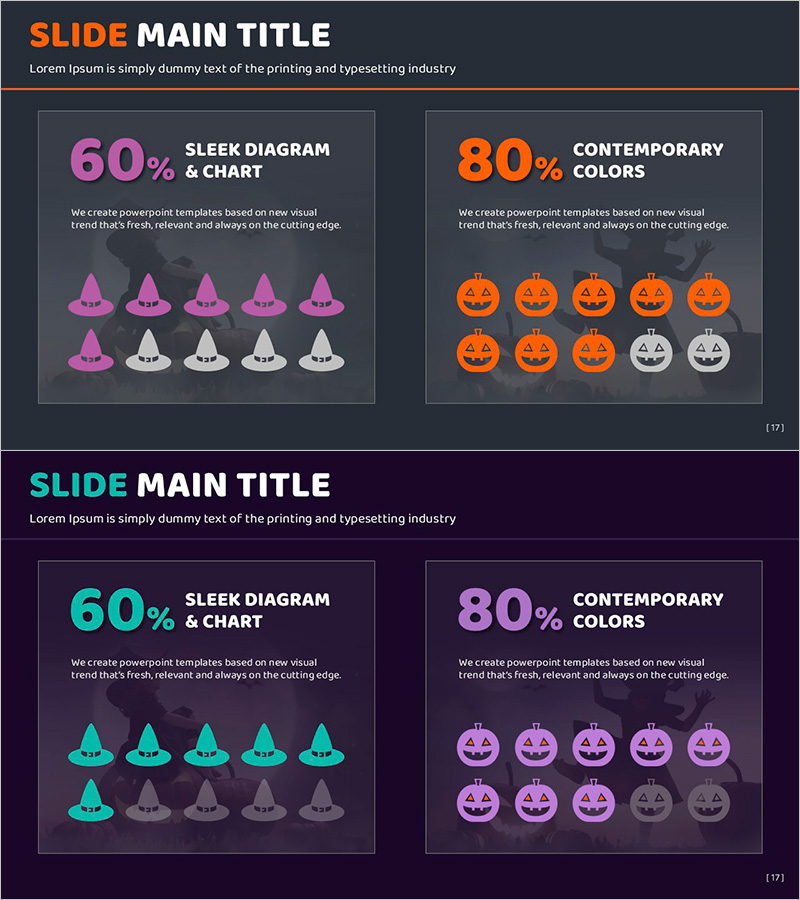
Halloween Hats and Pumpkin Charts – Ideal for Market Analysis
#Market and Competitor Analysis #Graph #Other
